
In my position I'm blessed to have access to dozens of top traders and investors, Adam being the BEST (in my humble opinion) and one guy I can always turn to is Mark McRae. Mark has taught us many times over the past year (see previous Mark McRae posts) and today I asked him back for your benefit! He's recently released a new trading report that's more of a mini-course then a one time report, so it'll be updated with ALL his latest findings. Please enjoy the article, ask Mark questions in the comments, and jump on his new trading report/mini-course!
====================================================================
One of the most basic and widely used indicators is that of momentum.
Before I go on to tell you how we can use the momentum indicator to trade with, I want to explain the difference between a leading and a lagging indicator.
Nearly all indicators are lagging indicators. That is to say that the price must first move in order for the indicators to react. So you will inevitable get a situation e.g. where the market will rise shortly followed by the indicator. This is where the term lagging comes form in trading.
On the other hand, an indicator that forecasts the move before it happens is called a leading indicator. If for example the indicator peaks and then turns down before price peaks and turns down then that would be a leading indicator.
You can use most indicators as both depending on how you mix them with time frames and settings. The reason I mention this is that momentum can be a very good leading indicator when used in a particular way.
Let's first talk about what a momentum indicator is - simply a visual reference point of whether a security is rising or falling and how fast that rise or fall is.
Construction of the indicator is simple - just subtract the close of the security X (whatever period you want)days ago from today's close.
The resulting number can then be plotted around a zero line. For example let's say we were looking at a 10 period momentum indicator. You would simply deduct today's close from the close 10 days ago. If the close was higher than the close 10 days ago then it would be plotted above the zero line. If on the other hand the close was lower than the close 10 days ago, the it would be plotted below the zero line.
As you would expect - if the momentum line is rising and above the zero line we can interpret that as a strong bullish trend. If the momentum line is below the zero line and falling we can interpret that as a strong bearish trend.
As you can see from our first chart, momentum can be a very good confirmation indicator. If you were using a moving average or a trend line to help determine trend, then a cross above or below the zero line could be just the confirmation you need.
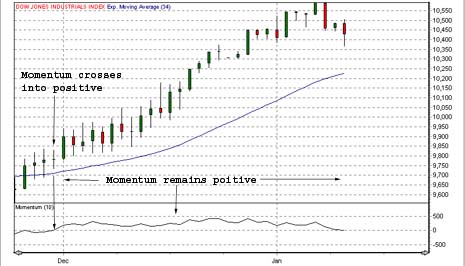
In the example above I was using a 34 period exponential average of the close. Price came back up and closed above the average and shortly after-wards the momentum indicator also closed above the zero line confirming the move. Not only that but the momentum line has remained above the zero line since the cross over. This would give you confidence that the trend is still in force.
In our next chart there are two important points I want you to take note of - the first is that of divergence.
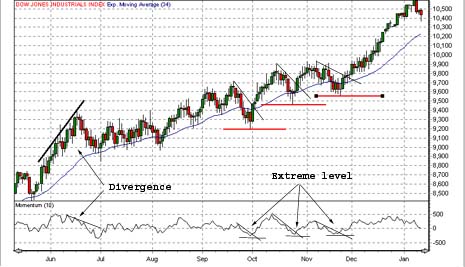
Divergence is when an indicator does the opposite of what the price on the chart is doing. In our example the momentum indicator started to turn down but the price continued up. This is bearish divergence. Often when this happens it is an early warning that the market is in an exhaust move. The indicator is giving us an advanced warning that the market might be getting ready for a move in the opposite direction from which it was previously heading. The opposite is obviously true for bullish divergence.
Next I want you to look at the three points I have marked as extreme on the chart. Forget the reading at these points - visually you can see that the three points are lower than the other points around them. When you have an extremely low reading in an uptrend then you have a good trading opportunity to go long. If you have an extremely high reading in a downtrend then you have a good opportunity to go short.
You could further confirm this by a shorter moving average crossing a longer average or as I have done with a little trend line. Nice, simple technique that will keep you on the right side of the trend and give you some great entry points.
Traders' Glossary
* Arbitrage - The simultaneously purchase and sale of identical securities to benefit from a discrepancy in their price.
* Ask - Also known as 'offer' - The price at which traders are prepared
to sell a security.
* Bear - Trader who believes prices will move lower.
* Bear Market - A market that is in decline (falling). A succession of lower peaks and valleys.
* Bid - The price at which traders are prepared to pay for a security.
Good Trading!
Best Regards,
Mark McRae
Trading Report/mini-course
Hello,
Thanks for this wonderful writeup.
Which direction should i go if the price is rising, but the MACD is falling?
Thanks
Thanks Michael
Hi Christian
You have just started an interesting journey on your
road to becoming a trader. Learn as much as you can and
always remember that money is hard to make and easy to
lose. Be ultra conservative in the beginning and don't
risk anything you can afford to lose.
Hi Patrick
Good question. It depends how you trade. Look at it
like this. I like to buy dips in an uptrend and sell
rallies in a downtrend. This helps reduce risk a
little.
If you were to jump into a trade that was already
trending strongly up you might find it difficult to
find a safe place to place your stop (assuming you are
using support and resistance to place the stop). This
example might help you find better places to enter and
place your stops.
If I have understood your question correctly you want
to know why I would enter a trade as momentum is
falling. I want momentum to be falling as the market is
rising. That tells me that it could very likely be a
temporary pullback in an uptrend.
As for exiting or knowing the difference. If you got
the entry right then the market should move in your
direction. If it turns sharply against you after the
entry then you either got the entry wrong or it was
just a losing trade.
Hope that helps.
Appreciate it Jeff
Great article Mark. This is an example of why I follow Market Club Trader's Blog (Thanks Brad!) and subscribe to the Trader's Library.
Keep up the good work! We all appreciate it!
~Jeff
Normally when momentum turns down in an up move it is an exit signal. When it turns down sharply it is a strong exit signal. Moreover the 34EMA line has been breached also signaling exit.
This appears therefore to be a counter-trend trade which is normally considered aggressive.
How do you differentiate between the two (i.e. ideal entry point versus strong exit signal). It is of course easy to see in the chart but the premise does not appear to follow fundamental trading principles.
I'm very confident that with your forex guide line as I've read it today 'll go a long way to help me as a new forex trader who has just started hours before I saw this website full of benefiting comments.
you are doing very well and keep it up.I'll also like to be informed in advance henceforth about the forex market situation before each trading day starts.
my regards.
Very good description inplain English. I will add that into my charts and it should do well with my volume.