

Our guest today is Tom Strignano, a former Chief Bank Dealer with 25 years experience. He has also been featured on The Forex Signals. Follow Tom as he shows you a technique he developed back in the 1990's incorporating Adam's favorite Italian mathematician, Leonardo Fibonacci. 
-------------------------------------------------------------------------------------------------------------------------------
The Fibonacci Range Expansion Trading technique is one that I developed back in the early 1990s when I was moving away from lagging indicators like RSI, MACD, moving averages etc. I had no success using those indicators and came to the conclusion that either I didn't understand them, or that they simply didn't work. The only thing that I had any success with was trendline breaks, Fibonacci points, and standard pivots with the reading of pure price action. I was taught that in order to be successful in this business of trading, you need a few components.
According to my mentor and senior treasurer, Aldo Pizzoferrato, trading required BMG, or Brains, Money, and Guts. You need the brains to anticipate market momentum and to be a step ahead of the herd. You need capital to advance, and finally, you need the guts to believe in yourself and your systems. Therein lies the problem for most traders. Most traders operate on the simplest level. They have no real trading plan and view charts and price action using gut feel or really just guesswork. Aldo stressed upon me that the most effective approach was acting like a quarterback of a football team. I need to send the signals, by reading the market and finding weakness in the markets’ defenses. He would always say, “Don't just receive the signals, send the market some feedback.” I had learned that trading is not a spectator sport. In other words, the most effective approach is in the development of systems that generate buy and sell signals. I had to move from "chart artist" to a true technician.
This trading technique that I am about to share with you will help you pick clear and defined points to enter into low-risk and high-reward trades. No longer will you have the excuse of trading with the rear-view mirror. The market will unfold its weakness, and you as a quarterback, will be able to make the audible call.
The Fibonacci Range Expansion Trading Zone Technique
Overview:
Price movements, up and down, very rarely continue uninterrupted. There are always counter trends to the main trend and at some point in time the trend will no longer continue to be your friend. The trend one day has to end.
The Fibonacci range expansion trading zone system attempts to capitalize on counter trends within a trend or even catch trend reversals. With the FRETZ (Fibonacci Range Expansion Trading Zone) we will use three distinct formulas.
1. The range of yesterday's daily bar, which is the H-L= x
2. Pivot point Calculation of the daily range from yesterday.
3. Fibonacci retracement levels inside the Fibonacci Range Expansion that we will calculate.
Set up:
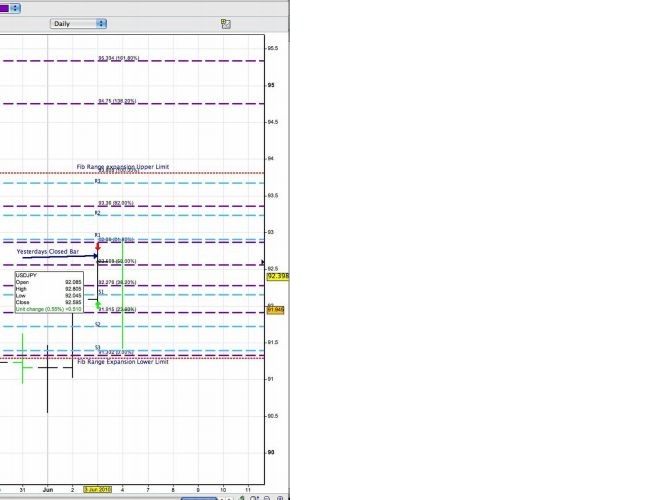
On the close of the previous daily bar we gather the following information: the high, low and close. Calculating the set up of USD/JPY on the close of June 3, 2010 will obviously be for the trading day of June 4, 2010.
The high was - 92.80
The low was - 92.04
The close was 92.59
We first calculate the daily range which is the high minus the low.
92.80-92.04= .76
Once the true range is calculated we multiply by the Fibonacci Range Expansion ratio of 1.618. Thus .76 x 1 .618 = 1 .2300
We then add and subtract this factor from the close to get the upper and lower Fibonacci range expansion values. The close of the upper Fibonacci expansion value is 92.59 + 1.23 = 93.82. The close of the lower Fibonacci expansion value is 92.59 - 1.23 = 91.36. These levels are what I call a mini market trench. If price breaks above or below the levels the market is telling me there is a potential shift in supply or demand. So these points are like a fence around the price action of yesterday. It is important to note that 85% of the time the markets trade in a range, and these levels will be excellent buy or sell zones. We will now continue to build our FRETZ matrix. We will add pivot points from yesterday's range onto our charts. This is a standard pivot point formula, and I will add a downloadable calculator in the near future. However, you should know what the formula is:
Base Pivot:
Pivot Formula = High+Low+Close/3= Base Pivot
Resistance 3 = High + 2*(Pivot - Low)
Resistance 2 = Pivot + (R1 - S1)
Resistance 1 = 2 * Pivot - Low
Support 1 = 2 * Pivot - High
Support 2 = Pivot - (R1 - S1)
Support 3 = Low - 2*(High - Pivot)
-----------------------------------------------------------------------
The third and final part of the Fibonacci expansion trading zone matrix is using your Fibonacci retracement tool. I would suggest changing the .786 level to .8200. I have found that the 82% works a bit better in foreign exchange trading. I know it's not much of a difference, but I am always striving for perfection. Here is a rule when applying the retracement levels: If the close of yesterday (the bar we’re using) was a down close mark (less than the open), start from the lower level first and then retrace upwards to the upper Fibonacci expansion level. Conversely, if the close on yesterday's bar was at an up close mark (close greater than the open), start from the upper expansion level first and then retrace down to the lower level. This idea keeps in line with my Fibonacci Strike System.
Now That we have all of these levels plotted, our matrix is set. We will use these levels as support and resistance. The closer the pivots and the Fibonacci Levels are to each other, the stronger the level will be. It’s important to note that if the market "zooms" through these levels, a shift has occurred in supply or demand. If you are on the wrong side, escape quickly (First Rule Of Trading is to preserve capital!) I use a simple trend line as a trigger to enter long or short and the Fibonacci and pivot levels as my resistance and support.
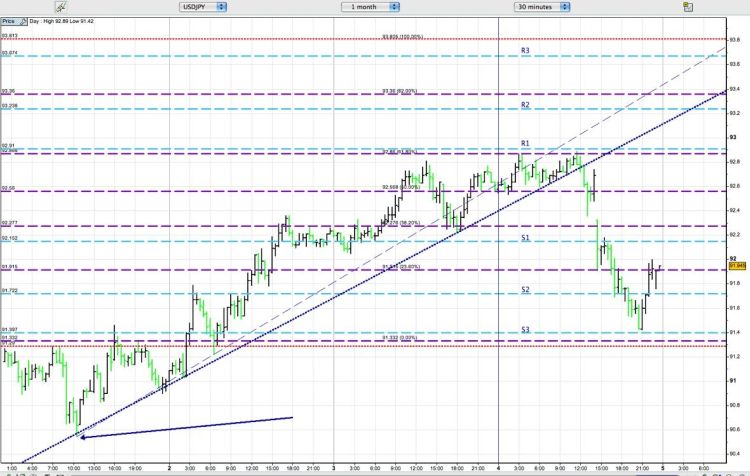
See Chart below for an explanation of trade that occurred in USD/JPY on June 4th 2010.
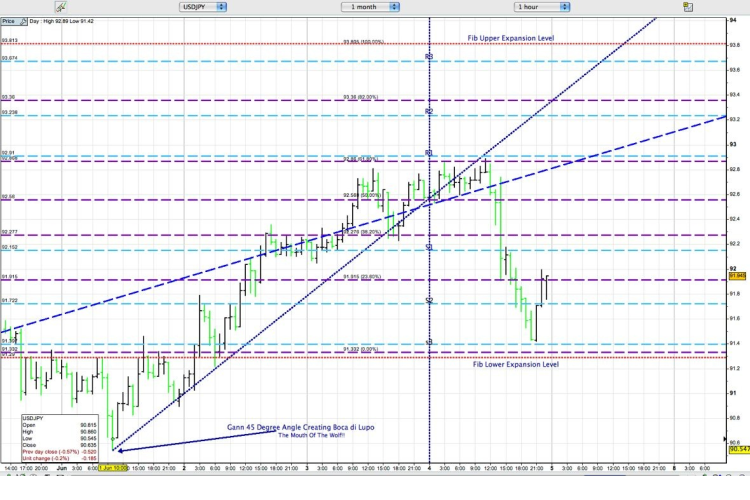
The chart above shows the full matrix constructed with the Upper Expansion level at 93.81 and the Lower Expansion Level at 91.36 (91.29 in this chart.) Also, note in trading the market that I pulled the lower expansion level down 7 pips as a warning. If USD/JPY broke all those tight levels that converged at 91.30-40 area, the move in my mind should be more violent.
I also just extended the trend line in this chart to extend out to infinity (it’s the red segment above).
Just to be clear, the light blue lines are the Pivot Support at Resistance Levels, and the purple lines are the Fibonacci Retracement levels calculated inside the range of the upper and lower expansion.
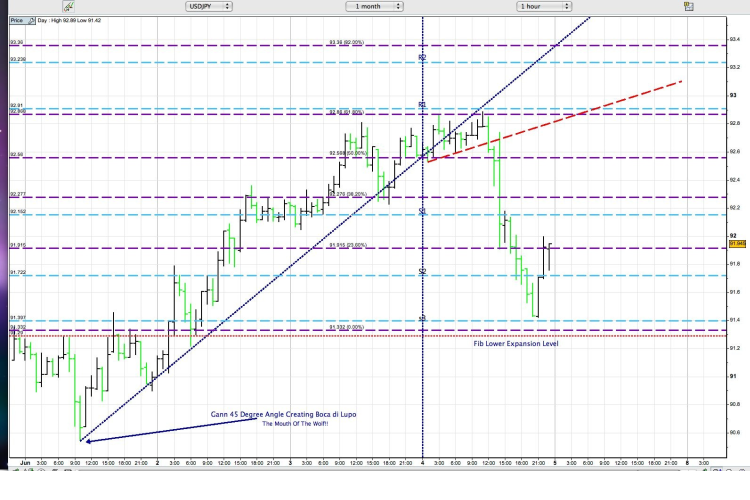
I added an advanced technique that I mentioned at one time or another: a Gann 45 degree angle of death from what was the closest Root Point low. A root point for me is the lowest low (or highest high). It’s the genesis of the up move (or down move.) I may confuse some here but study the chart. I picked the pivot low from where USD/JPY recovered and rallied up to 92.88 (this will now be the Root Point for the decline down to 91.42)
When I add this Gann line, I create what I call Nella Bocca di Lupo - the price has entered in the "mouth of the wolf.”
It’s in this area where the support line and the Gann line create the upper and lower resistance. A vortex that once the support is broken should trade lower to the internal Fibonacci levels. I will then gauge price action to determine how strong the move appears.
So how did I trade the USD/JPY?
The market price came up to the Fibonacci Retracement level at 92.88. There was a pivot R1 at 92.91 and the Gann line at approximately at 92.93. I sold the 92.83 level with a tight stop loss at 93.04 (markets tend to push one last time through a R1, so I need a little bit of cover) My first thought was that a 1:2 ratio was worth the risk, and I knew if the price could break the recent support at 92.66 Nella Bocca Di Lupo was in play! I should at least get a chance to scoop USD/JPY at 92.56 or better at 92.27 the lower Fibonacci levels. So the plan was to see if price could break the recent support and once it did how will it react? Will it get dull and stall or will it zoom through the Fibonacci Support of 92. 56? It zoomed through at that point I moved my stop Loss down to 10 pips above the entry price. I now need the Fibonacci level at 92.27 to break, and the S1 at 92.15 to go as well. I want you all to see how the market gave several opportunities to get involved in this short. Look how it retraced back up and slightly above the trigger line (old support line at 92.66) and failed. It then zoomed down through 92.27 and the S1 level at 92.15. It stopped dead cold at the 91.92 level. The market then rallied up to the S1 level at 92.15 (giving another opportunity for a short with a Stop Loss above the Fibonacci Level of 92.27) This is surgical accuracy, as a matter of fact its laser surgical Accuracy! Once the Market touched the 91.92 level, I moved my stop profit down to 92.37 just above the Fibonacci level, I was then planning on taking 1/3 my position off at the 91.72 S2 level. The market hit the S2 and 1/3 was taken off. I then moved my stop profit for 2/3 to the 92.15 level (the S1.)
The market came down within 7 pips of the S3 level (91.39ish) I scooped another 1/3 of the short at 91.51 and moved my stop profit down to S2 at 91.72 where the market decided to take me out. So, you see how important it is to send signals to the market, be that Quarter Back, and yes at times you will get sacked, but it’s all in the name of trading. After All...Profitable Trading Is Not A Spectator Sport!
As I always say, "Enjoy the party but dance near the door".
To join me, visit my signals & mentoring service The Forex Signals
Dear Adam
Its great trading TACTICs. I felt a suggestion that using above technique, one should keep MARKET TREND in mind. To further, if market is in bull rally, one should use buy points and put strict stop loss below support level and in Bear Rally, vice versa. This way, One can maximise benefit from this technique and its sure is proven technique.
An avid reader of MarketClub
regards
Naveen
I got this. And like the concept. Will take some time to set up on spreadsheets or configure into ThinkorSwim though.
I did find it very interesting. I would like to return on it with major details, Will it be possible ??
I understand the basic principle used here and believe that it is profitable as the author mentions. However, because of the numerous calculations, I believe one would need appropriate software to make the calculations and display or list the different levels for entry and exit points. I would like to know if such sofware exists, and if so, where it may be obtained.
Regards,
jean g.
I have the same interest. thks
Regards
marlon
Oh brother....
It will be better to go together with video.
I prefer Adams simple and articulate videos.
This is a excellent Handy tool to do day trading without any complex mehtod,it works in all markets.Thanks for such simple helpful tool to day readers.
The Gann Line puzzles me. A 45 degree Gann Line is a 45 degree line drawn relative to the chart scale used and therefore does not necessarily depict visually as a 45 degree line. For a true Gann Line to occur it must increase/decrease in price value by one unit from a low/high while at the same time increase in time by one unit. As the USDJPY prices are measured to 2 decimal places any one unit increase in price will be at a value of 0.01. A similar increase in time (the displayed chart is an hourly chart) will be a one hour increase. This relationship is not depicted on the provided chart, however when comparing it to my MetaTrader chart for the same period it does depict as a Gann 3:1 Line, i.e. 3 units of price increase for one unit of time increase. I would be interested to know the parameters of the example of the drawn Gann Line.
Hi Guys ..
the above charts were too hard to read here; poor resolution and size with the top chart cut off on the LHS.
Can it be uploaded again or can someone send it to me in word doc? It would be very much appreciated.
Also, Adam your videos open up at a good size on my 17in screen then shrink by half as the video is about to start, to just the LHS of my screen. Its readable but irritating. I don't think its at my end as I've had no other 'display' problems - maybe others get this also?
Yes, I always have problems with displayed charts other than MC. I believe its a technical problem with copying charts between media. Perhaps the presenters could blow up or enhance the charts before merging with MC.
MC, it would be good for your members if you could try to resolve this problem.
Thanks,
Ross Theadore
That is a nice combination of very fundamental analyses using Fibs and Pivots. Adding the Gann 45* clearly sets up the alert zone; but the 2 Fib levels near R1 would give such an experienced trader the same info and reward.
Anyone can pick one trade that hits every R/S point SOMEtime. I'd like to hear more about win/loss ratios and percentages. Also:
1. Do you move the Fib to 82% ONLY for Forex - or stocks too?
2. Does the system work equally well in most time frames - hourly, daily, etc.?
I'll bet we can find out if we go to the site and pay a small fee. 🙂
Thanks, Tom for taking the time to share!
Anyone know if we can draw a 45* Gann on MC charts - or do we just guesstimate?
Sounds like this method is working for the author. Well, great. I am happy for him.
I think that there are a lot of methods that work out there. In the end, what I keep in mind is that, trading is 80% psychology and 20% technical.
I use the KISS concept, chart reading ability with interpretation behing price movements + MC's triangle and it works for me.
At the end of the day, what moves prices are two simple things: Greed and fear. That is what drives the market.
Loic
Shear genius is a great haircut.
Which is more than just a cut above.
I can follow the technical details but I do not have a charting tool to allow me to replicate the method.
Can anyone make recommendations as to the better charting tools available.
Thanks,
Ross
Looks cool!!!
However, a bit complicated. Need to understand Gann more and how this would work going long. Would you be able to explain another example (preferably through a video like Adam) taking GBP/USD for June 17th using June 16th data. What is the success rate for this one.
I enjoyed it, it wouldn't work as a video as you need to see the formulas written down and go through the process slowly, what i would like to know is if this lends itself to all major currency pairs or if it works better with specific pairs only?
Correction: STP 15C
ASTM Manual on Quality Control of Materials
Pages: 152 Published: 1951
Couldnt understand much video would have been much helpful.
For those having difficulty with either the concept or the metrics the entire method is similar to quality control in production processes (ASTM STP-11) when you use the values of the previous two outputs to set limits that indicate the process is in or out of control. I do not remember the exact calculus but it is conceptually the same and attempts to determine the limits that are "reasonably likely to occur" when all you have is the values of the previous two outputs. In quality control of production processes one uses the "central tendancy" of the data (a "mean" or other type of "average") and the variability of the data about that central tendancy (as the "range" or "variance" or "standard deviation") to predict future values that are reasonably likely to have come from the universe of the data set defined.
One comment on the "central tendancy" calculation: using (Hi + Lo + 3xClose)/5 is a better estimate than the suggested (Hi+lo+Close)/3
Another on the "predicted range" using (Hi-Lo) that gives similar results is to accept that the (Hi-Lo) define the 95% probability limits of a random process and therefore is a range of +/- 2 standard deviations (SD. The 99% limits of +/-3 SD are 1.5 times further from the mean "central tendancy) than the (Hi-Lo) range. He uses 1.618 or about 3.25 SD's, which interval contains some 99.99% of a normal distribution.
You can get similar and directly related values by using small period charts and using Bollinger bands. Using 20 period settings on 15 minute intervals and 3 SD gives approximately the same results.
Why is "(Hi + Lo + 3xClose)/5" a better estimate than the suggested "(Hi+lo+Close)/3?" I have been using the latter for pivots ()for years now) and would appreciate an explanation. Thanks in advance.
Same goes for me. I think this is for the readers who are tech traders. Unless one has read and understood at least read parts of this stuff before it is difficult to read and apply from scratch. Also, Adam's are moving pictures and simple, not complicated.
Unh? I stick to to MC's "Trade Triangles" and my own SCA indicator.
I too can not figure out this application completely. What I do understand I like. Just not comfortable. Can we "see" this as a video? Could we expect another attempt to explain the concept and mechanics in more depth? Thank you
seems like the sort of thing i'd like to know more about but i can't grasp it from writing and illustration, that's just something i've discovered about myself. On the other hand Adam's videos i understood and bonded with almost straight away
This is shear genius!!!!