
Each week Lo ngleaftrading.com will be providing us a chart of the week as analyzed by a member of their team. We hope that you enjoy and learn from this new feature.
Weekly Gold Report
Two words can best define the sentiment of most major markets over the last few days of trading……..RISK ON.
Monday through Thursday last week saw disappointing news in the United States and abroad that dragged on almost everything outside of the US Dollar and the US Treasuries. There were no positive reports in Europe, China, or Japan. Furthermore, things are escalating quickly in Israel and dragging on global sentiment. Lastly, the United States put the blame on Hurricane Sandy after huge misses in the Initial Claims and Philly FED Report. There was also continued pressure on the markets as all major news outlets anticipated the outcome of the Fiscal Cliff debates in Washington. That is, until Friday………
Friday afternoon, US Democrats and Republicans adjourned an initial meeting regarding the Fiscal Cliff and announced their eagerness to work together to avoid disaster at the end of the year. So far, this announcement has been enough to help markets continue Fridays rebound.
With a shortened, Thanksgiving Holiday week in the United States, traders will likely be watching for any news from Europe on Tuesday as the IMF and the EU convene to decide how to finance a two year loan extension for Greece. Outside of this decision, we should be looking for technical support and resistance levels on daily charts before Wednesdays close.
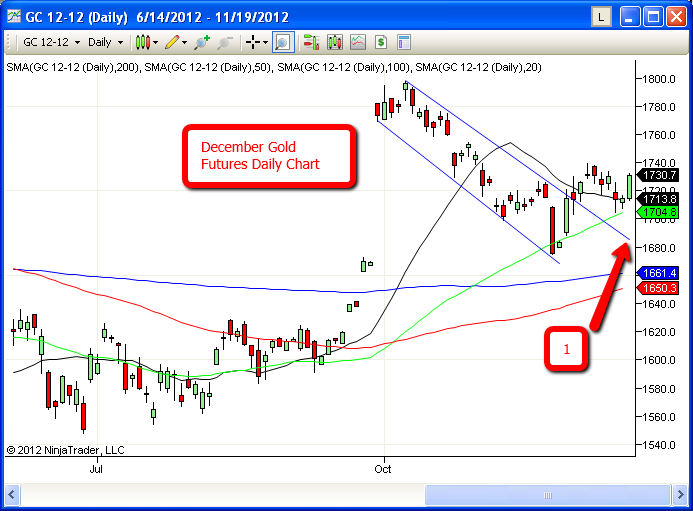
Last week the December Gold Futures were mixed as the market used both the 20day and the 50day moving averages as support. (See chart….20 day in black, 50day in green). So far this morning, there is a strong bid that appears to be targeting last week’s high near $1740. I believe that most traders will be waiting for the futures market to confirm a break above $1740 before committing to a bullish breakout. A failure at $1740 this week would send the market back to last week’s support levels again. If somehow there is heavy liquidation below the 50day moving average, the market would likely target $1680 where the former resistance trendline would now become support (arrow #1). I doubt there will be anything this week that would send the market below this price on the chart.
Good luck this week and Happy Thanksgiving! As always, if you would like to speak with me regarding trading in the Gold Futures or any Futures Markets, please feel free to call my office directly at (888) 272-6926 or feel free to email me at [email protected]. I will be happy to address any market related questions that you may have.
Thank you for your interest,
Brian Booth
Senior Market Strategist
[email protected]
888.272.6926
unless and otherwise Gold Cross the $ 1755 and $ 1815, no hope for any major further bull run... and if break $ 1690 and 1645, down down and down will be there.
That seems to be the case Rasesh. But most traders are very interested in having some type of exposure inbetween those prices. Technical support and resistance numbers inbetween are the focus as we speculate on a direction.