
Each Week Longleaftrading.com will be providing us a chart of the week as analyzed by a member of their team. We hope that you enjoy and learn from this new feature.
June Natural Gas (NYMEX:NG.M14.E) opened sharply higher in Sunday evenings session, but since the open prices plummeted to a 5 day low. The sell off confirmed a bearish outside reversal ahead of today's US session. June Natural Gas futures remain under pressure from last week's EIA storage report that showed a larger than expected supply build of 82 bcf. Recent weather forecasts have been calling for warmer temperatures across the country which could limit the size of upcoming supply injections.
In recent weeks, we have been in a sideways trend in the June Natural Gas Market as the market decides on which direction it is headed next. The technical analysis in Natural Gas points to bearish in the near-term, making way for a potential swing trading opportunity.
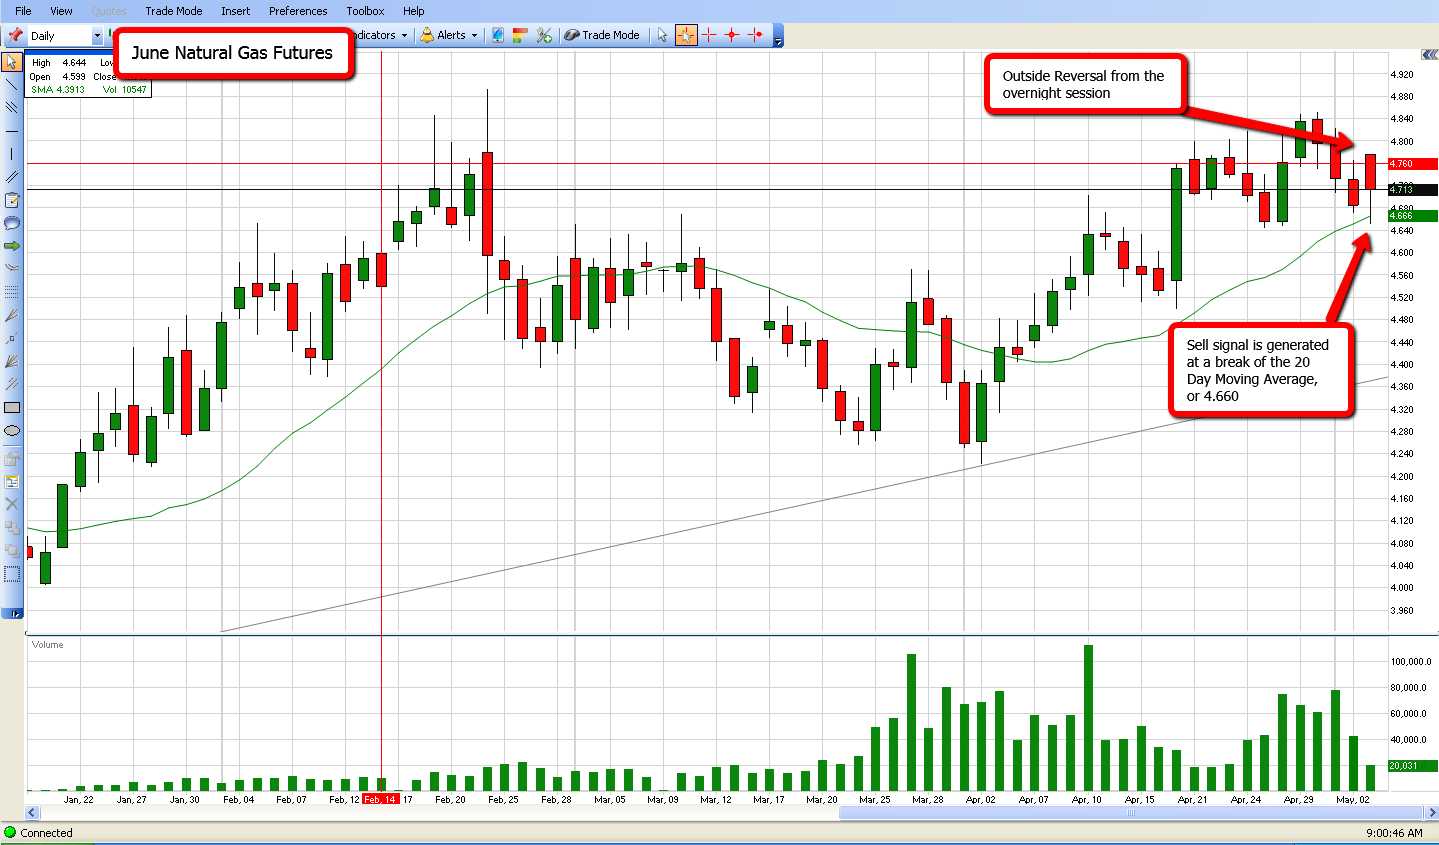
In today's trading session, I will be looking to sell June Natural Gas futures at 4.660, or a breach of the 20 Day Moving Average. This breach would confirm the outside reversal in today’s trading session. My first downside target would be 4.500, a recent area of support in the market, at which point I would roll stops to break-even. If the 4.500 are is hit, then I would look at 4.380 as my next target, which would be support from the long-term trendline. To mitigate risk on the trade, stop-loss orders should be placed just above today’s trading range and rolled behind the trade accordingly.
I advise clients on trading futures and futures options markets on a day to day basis. If you have any questions regarding this chart or questions regarding trading futures and futures options, feel free to call me directly at 888-272-6926.
Thank you for your interest,
James Leeney
Account Executive
Phone: (888) 272-6926
www.longleaftrading.com
** There is a substantial risk of loss in trading futures and options. Past performance is not indicative of future results. The information and data contained in this article was obtained from sources considered reliable. Their accuracy or completeness is not guaranteed. Information provided in this article is not to be deemed as an offer or solicitation with respect to the sale or purchase of any securities or commodities. Any decision to purchase or sell as a result of the opinions expressed in this article will be the full responsibility of the person authorizing such transaction.
The COT chart corroborates the downward pressure on Nat.Gas. (NG)
https://dl.dropboxusercontent.com/u/29771494/COTReport/COTReport.html
Other charts of note are :
• the dollar (DX) which looks like a bottom has formed and should drift higher.
• the 30 year treasury (US) has topped.
• AD and BP have topped too.
• Cocoa (CC) should tumble with the BP
• Coffee (KC) has seen its quarterly high; starbucks was right to wait to start buying again...
• HG, copper, looks ready to bounce.
• Lumber (LB) looks to have found a bottom.
• Those playing the rough rice (RR) range trade, we should head back to 16 here again.
• Both SI and GC have found a tiny reversal in their COT plots. Despite the reversal of the dollar will we see an up tick in these? Could all three of these head higher? Doubtful, so a higher DX -- AND -- higher GG,SI may not occur.
• The primary grains C,S,W all look over extended.
• Lastly, have we finally seen the high in the beef prices? Probably.