Each Week Longleaftrading.com will be providing us a chart of the week as analyzed by a member of their team. We hope that you enjoy and learn from this new feature.
This week's focus turns to the September 30 Year Treasury Bond Futures. The S&P 500 stock index has closed in the green 6 out of the past 7 trading sessions and many investors feel it may be time for stocks to partake in a minor correction. Typically, gold futures will receive a lot of the flight to safety bid in this case. Due to the recent break of consolidation in gold futures with the path of least resistance pointing down, 30 Year Treasury Bond Futures look to be the candidate to receive this bid.
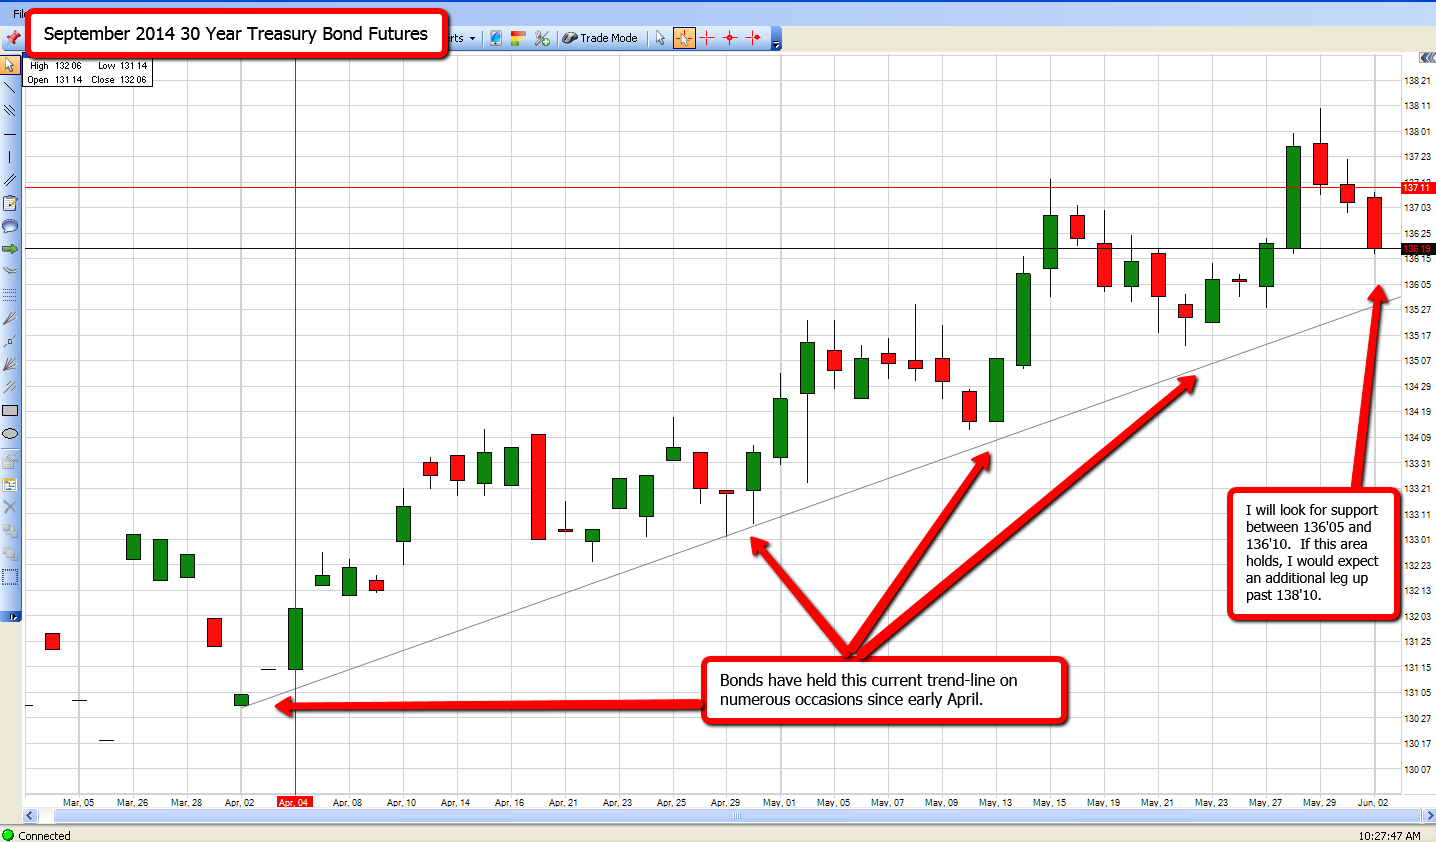
On the technical side, September 30 Year Treasury Bond Futures have held a perfect bullish market structure since early April. Since the trend has been established, the market has held on every test making higher highs and higher lows. Since establishing a new high print of 138.10 last week, we have once again seen a retracement towards the original trend-line as the market looks for support.
If we move lower in the coming days, I would look for the market to hold support in the neighborhood of 136.05 to 136.10. If the market does hold this area, I would become a buyer of outright futures with an upside target to put in a new high above 138.10. Stop loss orders should be worked just below the trend-line acting as support.
I advise clients on trading futures and futures options markets on a day to day basis. If you have any questions regarding this chart or questions regarding trading futures and futures options, feel free to call me directly at 888-272-6926.
Thank you for your interest,
James Leeney
Account Executive
Phone: (888) 272-6926
www.longleaftrading.com
** There is a substantial risk of loss in trading futures and options. Past performance is not indicative of future results. The information and data contained in this article was obtained from sources considered reliable. Their accuracy or completeness is not guaranteed. Information provided in this article is not to be deemed as an offer or solicitation with respect to the sale or purchase of any securities or commodities. Any decision to purchase or sell as a result of the opinions expressed in this article will be the full responsibility of the person authorizing such transaction.


I guess you should have waited a day before posting your article, as it blew past 136 and now sits at 135. Bearish MACD is now wide open and it has fallen below it's double top belly.