
It's hard to believe that the third quarter of the trading year is coming to a close today. It has been quite a quarter, especially the last week of September when the market volatility has been picking up.
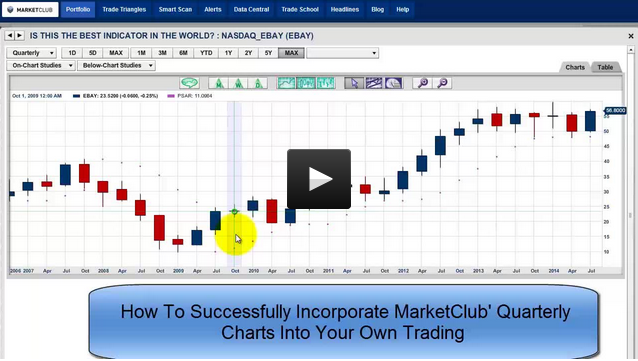
One of the tools I love looking at in MarketClub is the quarterly charts on all the markets. These charts were created to show you the big picture, as we know that investors can get sucked into short-term thinking and trading and "cannot see the forest for the trees." The biggest stand out feature for quarterly charts is their ability to clearly show the direction of the big trends. And that is really how you make the big money in trading by staying with the big trends.
Day trading can be looked upon as "very sexy," but it's not where the big money is. Arthur Cutten, a well-known trader and investor in the 20s and 30s, was asked how he made so much money trading and he answered the question this way, "By sitting."
By sitting on a position and holding it for some time, Arthur Cutten was able to amass a fortune well over a billion on dollars when you take in inflation. So with those thoughts in mind, I would like to share with you in today's video how to look at MarketClub's quarterly charts and how to use certain technical indicators that can help you see the big trend picture.
I am pretty sure that very few traders look at quarterly charts anymore and that's why I want to share them with you today. I learned a long time ago when I was trading as a member on the floor of the Chicago Mercantile Exchange the power of quarterly charts.
In today's video, I will be examining the major indices along with several other markets, including some top stocks.
After you watch this video try running some of your favorite stocks through this very simple indicator and see what you come up with. The results may surprise you.
Every success with MarketClub,
Adam Hewison
President, INO.com
Co-Creator, MarketClub
Dear Adam,
Yes this is absolutely true observation, Picture shown in quarterly charts is more precised, trustworthy, and applicable, and that while, proven as a more profitable too.