

This week I have prepared a Silver macro data analysis with diagrams and added a technical outlook for "dessert".
Supply and Demand
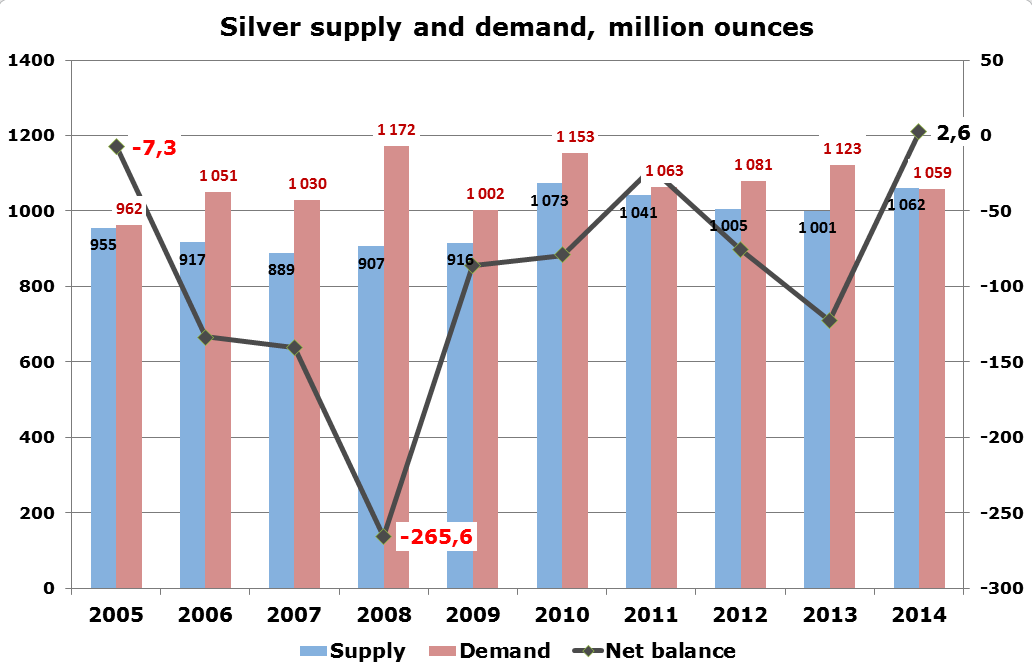
Chart: Aibek Burabayev; Data source: GFMS, Thomson Reuters / The Silver institute
Back in 2005, both supply and demand for Silver were below 1 billion ounces (Boz) and were well balanced with a small deficit of 7.3 million ounces (Moz). Since then they have risen with different speed and in 2014 both broke up that level. As seen on the chart above, the supply of Silver is quite stable with a narrow 889-1073 Moz range in past 10 years. 2010 (growth in mining and scrap supply) and 2014 (10 year record mining production) are the highest years of supply.
Demand was accelerating at a faster pace than supply and peaked in 2008 at 1172 Moz amid investors demand for Silver coins, bars and ETF shares during the global meltdown. Industrial demand with a share of more than half of total demand is the most stable component, although the internal structure is quite mobile, a growing bid from China and Taiwan is offset by the weakening demand in developed countries.
A net balance of demand and supply made a W-turn from -7.3 Moz balance shortage in 2005 to +2.6 surplus in 2014. The highest deficit of -265.6 Moz in 10 years was recorded in 2008 as crisis spurred top demand as supply remained unchanged.
ETF Demand Ran Dry as Jewelry Demand is Blooming
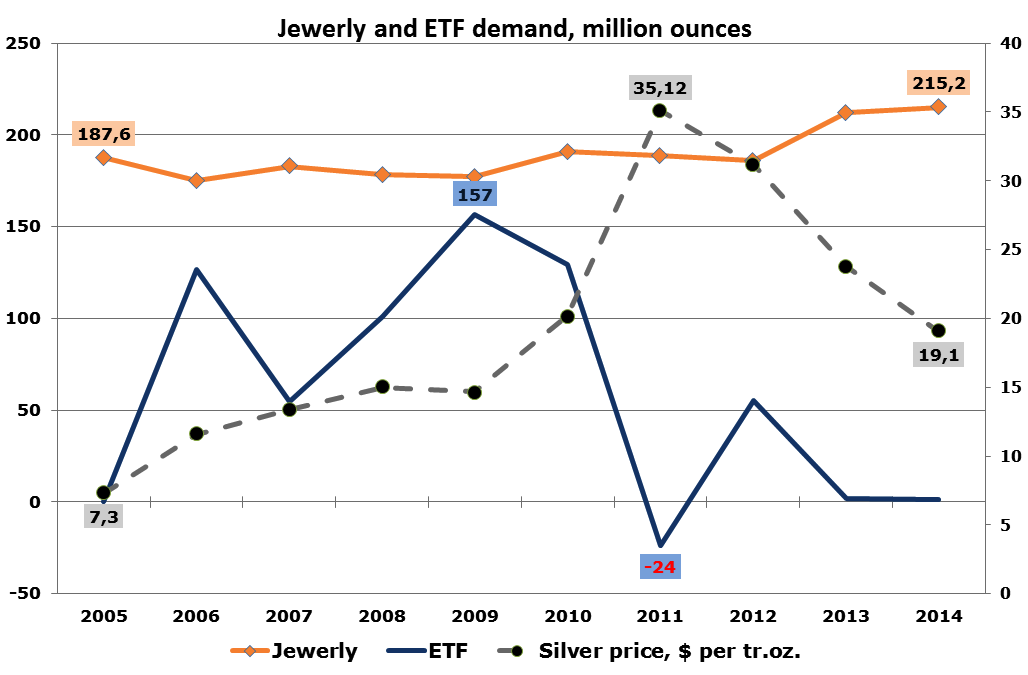
Chart: Aibek Burabayev; Data source: GFMS, Thomson Reuters / The Silver institute
If an economist were to look at the diagram above he would probably say that ETF demand is elastic and jewelry's demand is unsteady. In other words, the ETF holdings correlate directly (of course they do, as investors hold Silver for profits, not for fun) and the jewelry consumption is variable, it had an opposite correlation at the threshold and at the end of the 10 year period, but in the middle it rose with the price (traditions, income, fashion rules, demand).
Again as with Gold ETFs, we can see that Silver ETF holdings are not just price sensitive, but more driven by investor sentiment, especially fear and greed. In 2006, the metal price soared for 58% compared to 2005 from $7.3 to $11.6 per oz and buyers' greed pushed ETF holdings high compared to the zero holdings change in 2005.
Great recession fears added even more to the holdings change which had peaked in 2009 at the 157 Moz mark, although Silver was slightly cheaper that year compared to 2008. What is more interesting, is that further in 2010-2011, investors had gotten rid of Silver massively when the price of the metal doubled in 2011! Looks like irrational herd behavior, but in the following period from 2012 until today, the metal lost more than half its value, so you can call it unbelievable investors' providence.
Another story is the jewelry industry. Demand is very stable regardless of price with fluctuations limited within +7/-7% range year on year. 2013 was the only outstanding year with a stunning demand growth of 14% or 26 Moz. In 2010-2011 on robust metal price lift, demand was also higher than that in 2005. It Looks like not only are diamonds and Gold a girl's best friends, Silver is also among the favorites.
Silver's Technical Outlook is Neutral So Far
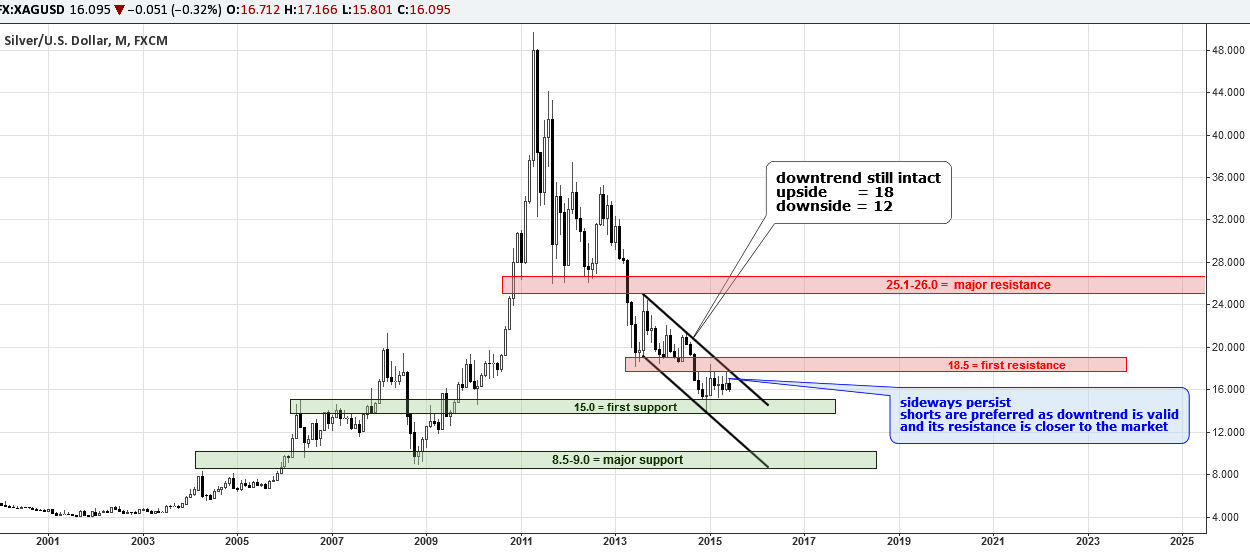
Chart courtesy of Tradingview.com
The Silver market is still there after 8 consecutive months inside of the mouth-drying range of $15-$18.5 per oz. The candles have small bodies and long wicks, it tells about accumulated indecision, usually monthly candles are not shaped this way for several straight months. Something really strange is happening in this market.
Despite the clear downtrend on the chart above, Silver can't advance downward. Like a fly trapped in a can, as it tries either direction no breakthrough appears. That's why the candle bodies are so small and the wicks are so long as buyers sell on the kickback and sellers buying back on the ricochets at breakeven prices as targets are not hit on either side.
Downtrend sides are $12/oz on the trough and $18/oz on the top and that's it. Horizontal barriers are closer to each other: supply area at $18.5 and demand zone is at $15.
At the moment short trades are more preferable as we can hide stops right above double resistance above $18.5 and wait until a drop to the $12 level. The distance to the stop is shorter than at the long trade. But we still need to break below $15 which managed to hold bear attacks so far. The overall outlook is neutral as the sale is best closer to the $18 area.
Intelligent trades!
Aibek Burabayev
INO.com Contributor, Metals
Disclosure: This contributor has no positions in any stocks mentioned in this article. This article is the opinion of the contributor themselves. The above is a matter of opinion provided for general information purposes only and is not intended as investment advice. This contributor is not receiving compensation (other than from INO.com) for their opinion.
Mass consumption of photographic film and paper are dead, forever, but silver is needed in the solar power industry, which is growing fast and is going to have to grow much faster. I would never consider silver an investment, but for a long term speculation for a person relatively young who can afford to sit on it for 5, 10 or more years, I think it's a good deal. If I were 25 years old, I'd be buying three or four times a year in modest but significant amounts, depending, of course on what I could afford to sit on. For old farts like me, silver coins make nice gifts to young people.