

More than a year ago, on the 15th of January 2015, the market was shocked by the sharp move of the Swiss National Bank (SNB) abandoning the cap of the Swiss franc to the euro. I dedicated a special post to that event. This time, I've made a comparative chart for the period from the start of 2015 until today to show you how the SNB's move affected the safe haven currency for the past 13 months.
The Swiss franc is in an inverse cross here (CHFUSD) to comfort your perception of both assets dynamics against the US dollar.
Chart 1. Gold vs. Swiss Franc: Gold Wins Again
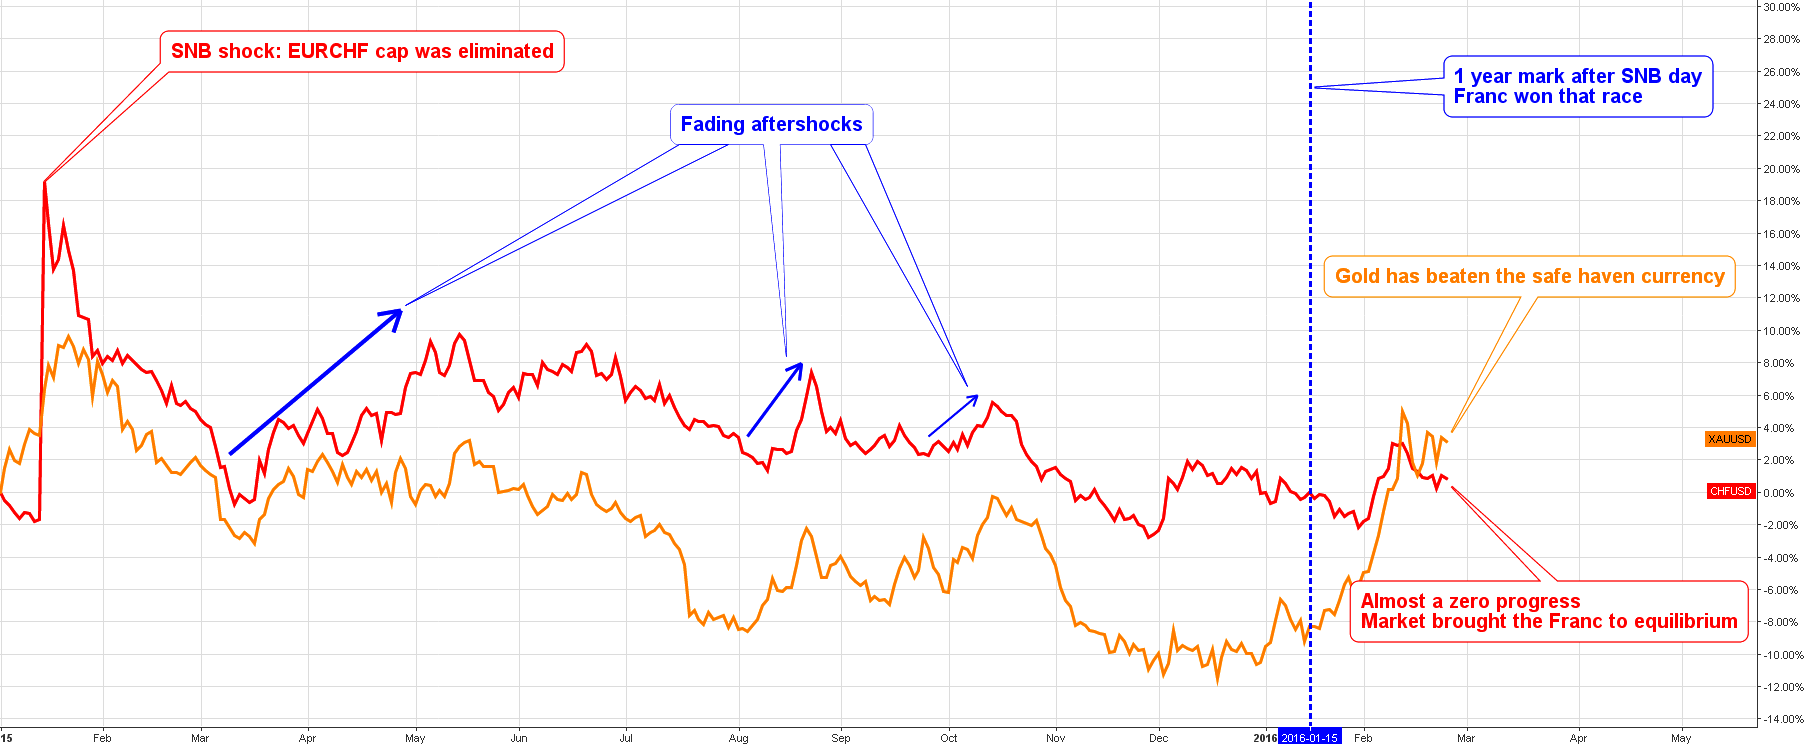
Chart courtesy of tradingview.com
The shock was short-lived as the currency quickly lost the gains during the first quarter of 2015. The Franc caught up with falling gold in a very tight correlation. They bottomed at the same time in March of 2015 and then reversed to the upside and peaked in May of 2015. The similarity of trends continued with the metal gapping deeper on the drops. Rare short interruptions of the link occurred last December and this month when gold increased its value and the franc didn't.
I highlighted the fading aftershocks in the strength of the franc with three blue decreasing arrows. After that, the currency broke below the pre-SNB level losing all of the gains. I also added the blue dashed vertical line to mark the exact one year period from the SNB action, on the 15th of January, 2016 the Swiss franc was still much stronger than gold with a huge 8% gap. But, this month, the metal won back all its losses and outperformed the currency. For the past 13 months, gold gained 3.4%, and the franc only gained 0.9%.
Switzerland faces a hard time with the worst deflation at -1.3% and the most negative rate at -0.75%. Chairman Jordan said that he can't rule out both more negative rates and forex market interventions to weaken the overvalued franc. If these two safe havens continue to move hand in hand, especially when risk aversion will grow, it will put the franc under pressure as it is not the desired path of the mighty SNB. But let us see what will happen this year as history teaches us that the central banks are often weak against the market.
Chart 2. Gold/CHF Monthly: Gold Is Going To Hit It Harder
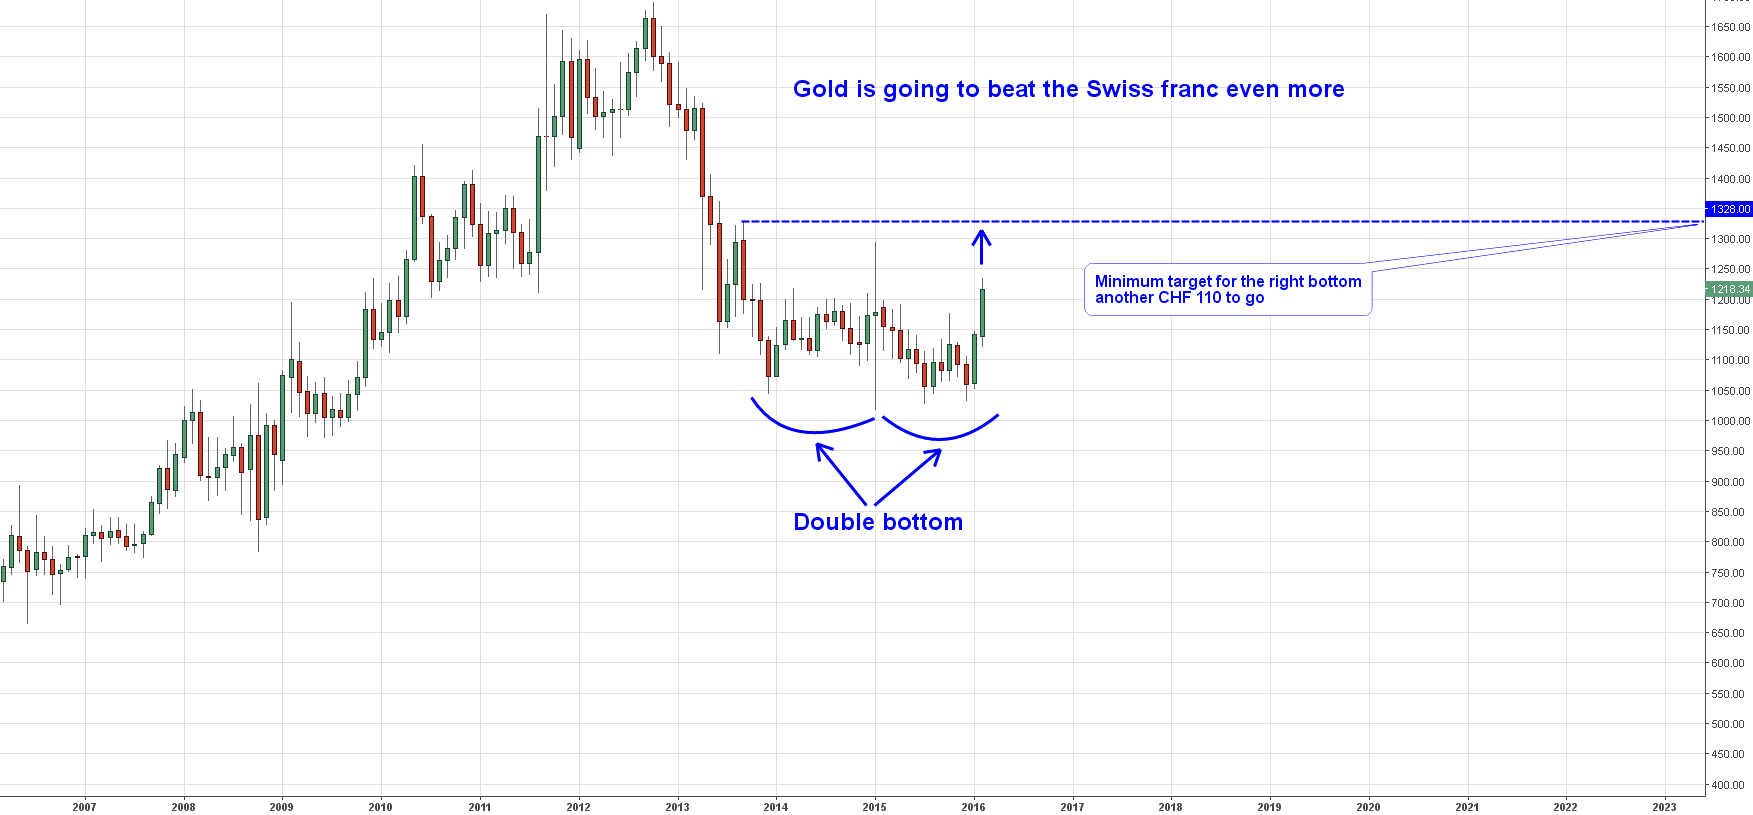
Chart courtesy of tradingview.com
Here is another interpretation of the gold franc correlation in the form of a synthetic metal cross on the chart above. I highlighted one of the most popular patterns with blue semicircles; it is a Double bottom which reversed the metal to the upside. The pattern started in September 2013 and has been in action for almost 3 years. The minimum target for the right bottom's upside is located at the top of the left bottom at 1328 CHF per ounce mark. It is another 110 francs to book.
This is not a good trade for cautious traders as the action is already in the middle. But, If someone cares, he should be nimble to cut the long position on any serious drop down – at least the 1:3 stop/profit proportion should be obeyed, 110/3 = 37 CHF per ounce is the maximum loss you should suffer. The stop should be set to not lower than 1181 CHF mark to minimize the risk.
Intelligent trades!
Aibek Burabayev
INO.com Contributor, Metals
Disclosure: This contributor has no positions in any stocks mentioned in this article. This article is the opinion of the contributor themselves. The above is a matter of opinion provided for general information purposes only and is not intended as investment advice. This contributor is not receiving compensation (other than from INO.com) for their opinion.
Aibek, I am still waiting for your answer about Bitcoin !
Many greetings
Ernie
nice. thank you.