
Yesterday, the Trade Triangles issued a green weekly Trade Triangle for gold. Gold (FOREX:XAUUSDO) now has three green Trade Triangles indicating that it's ready for the next upward leg in this long-term bull market.
As I have pointed out before, this quarter is the highest-rated quarter with an 83% success rate for gold trades using the Trade Triangles. Let me just be clear that this does not mean that this particular trade is guaranteed to be successful, but the odds are heavily in your favor.
I've added two charts below, a daily chart and a quarterly chart to illustrate the last time gold was in a prolonged bull market. That bull market started in Q1 of 2009 and continued for 11 quarters ending in April 2011. On the quarterly chart, you will see that every quarter for those 11 quarters the market closed higher than the previous quarter. If that same scenario plays out again, gold has 9 quarters to go.
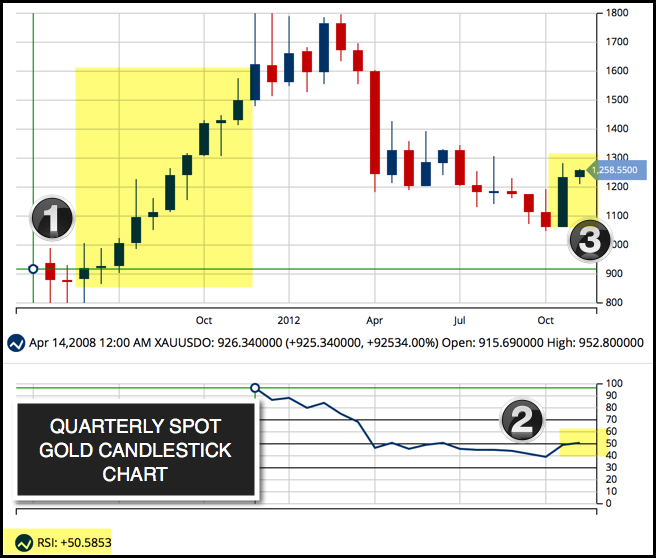
Key To Quarterly Chart
1) The start of the 11-quarter bull market
2) The RSI indicator moves to its highest levels in 3 years
3) Gold is 2 quarters into a long-term bull market
While the quarterly chart gives us a view of the big picture of how gold has acted in the past, the daily chart shows you how to use the Trade Triangles. For intermediate-term trading, you use the weekly Trade Triangle, which we just had a signal with yesterday, as the trend indicator and the daily Trade Triangle for exit and entry signals. If you are a long-term trader, then you want to rely on the monthly Trade Triangle, which has been positive for quite some time.
Looking at the daily charts, you can see that the bull market began in late December, early January of this year. Since the middle of February, the market has generally traded in a broad range bound by $1280 on the upside and $1200 on the downside. I believe that yesterday's weekly Trade Triangle at $1259.65 indicated a move back to the upside and should be used by intermediate-term traders to enter positions. Gold may still see some choppy two-way action, but generally speaking I think the trend from now on will be on the upside.
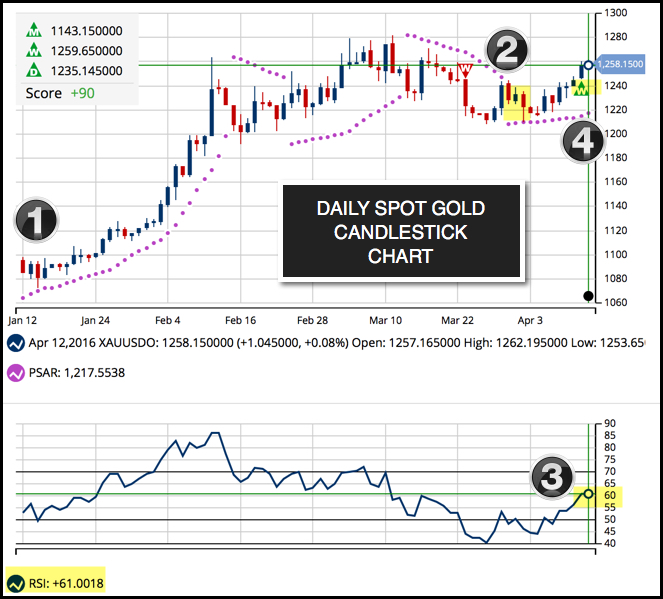
Key To Daily Chart
1) The start of the new bull market
2) Gold moves over the PSAR
3) The RSI indicator has a 61.11 positive reading
3) Weekly Trade Triangle indicates a resumption of the bull market
How To Trade Gold
There are several ways to trade gold; you can trade gold stocks, gold ETFs, gold futures and options on gold. The best known and most liquid ETF is SPDR Gold Shares (PACF:GLD), gold mining stocks to consider are Barrick Gold Corporation (NYSE:ABX), Newmont Mining (NYSE:NEM), Goldcorp Inc. (NYSE:GG) and AngloGold Ashanti Ltd. (NYSE:AU). Consult your brokerage company for information on options and futures and find out if your account is allowed to trade them.
Stay focused and disciplined.
Every success with MarketClub,
Adam Hewison
President, INO.com
Co-Creator, MarketClub
The 'HUI' also gives a buy or sell signal. If at the end of the current month it is above the previous 12 month high, you buy. If it is below, you sell. You only have to check it once a month.
Dear Harley,
Your Theory is quite interesting, you are very kindly requested to provide me more in depth details for the same. Is there any book or material available?
Regards,
Rasesh Shukla
[email protected]
Dear Adam,
This is a Good study and Observations.
On the basis of above, as one of the possibility, if we presume constant Bull Run in Gold, before taking any sound and reliable decision, we must consider flat or almost horizontal or side way type movement between $ 1200 and $ 1280, taken place from early February to present time, because between this period, Gold is trading within this narrow range, without breaking either upper and or lower area of that particulate range.
At this juncture, i am not denying possibilities of any further up-side movement, however, constant two quarter higher closings too, not confirm any sustainable bull run, because it will be interesting to observe that flat trading channel, so now this is a very crucial period in which, side of range will be broke, so if Gold will trade higher above such range, and with sharp jump, trade above $ 1325+++ for minimum three days, then it may consider as "succeeded" to break upper range. wis.wis if break its lower range, and trade again bellow $ 1175 to $ 1160, there after chances of Bull run continuation will be seriously questioned.
With a view to above, even quarterly chart is showing some hopes, but i think, till it is a " Wait and Watch Face for Gold Bull Run, and one must keep away from bias mind with any particular direction, either up or down.