

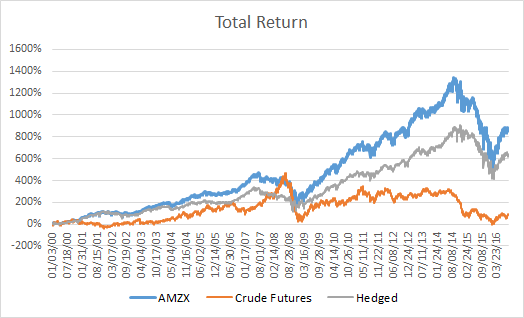
Energy-focused master limited partnerships (MLPs) have provided investors good returns over time, much better than owning crude oil futures. For example, from January 200 through July 2016, the Alerian Total Return Index (PACF:AMZX), a leading gauge of energy MLPs, provided a return of 867%, far exceeded the return from crude futures of about 63%.
However, there is reasonably strong correlation between AMZX and crude futures prices. As a result, AMZX has suffered some large drawdowns. It maximum drop from peak-to-valley (P2V) was 58% over the period mentioned above. I use P2V as my primary risk measurement because it shows how large a loss one may experience in a buy-and-hold strategy.
I tested hedging AMZX by maintaining a short position in crude futures. The risk-minimizing hedge ratio for crude futures was -17% but it only reduced the maximum P2V to 50% (see Hedged return in graph below).
I therefore applied the risk management process I developed to determine when to be invested in AMZX and when to go to cash. I provide the citations for the mathematical formulae and back-tested results for anyone interested in utilizing this process below.
Vertical Risk Management
Modern portfolio theory (MPT) is a theory of finance that attempts to maximize portfolio expected returns for a given amount of risk. The Endowment Model of Investing (EMI) is built upon MPT and includes alternative assets.
MPT is inherently flaws and EMI results in high risks. The 2008-09 financial crisis demonstrated fundamental problems for investors using EMI:
• their portfolios were exposed to unexpectedly high risk, their risk exposures were much higher than they thought,
• their risk tolerances were much higher than they thought,
• their risk tolerances were lower than they had believed.
Given these issues, I created a risk management strategy, which I call Vertical Risk Management because it alters the amount and direction of exposure to the market.
The primary objective of Vertical Risk Management (VRM) is to manage the downside risk to keep losses within a tolerable range. The thesis is that the best investment is one in which an investor can maintain a strategy that attempts to capture the upside potential as long as the losses do not exceed a loss threshold.
In summary, my VRM model is based on the Feedback Model described in Nobel laureate Robert Shiller’s paper, From Efficient Markets Theory to Behavioral Finance, (see pages 91-96, with his feedback model described mathematically in the footnote on page 95). Essentially, he argues that the emotions of greed and fear drive market prices far too high on the upside, and much too low on in downturns.
I developed and tested hypotheses to try to quantify conditions that might make investors feel greedy and fearful. And it turns out that the size of market gains and losses, combined with the speed, does a pretty good job in determining when to be long, when to be out, and when to get short. I added risk management algorithms to Shiller’s Feedback model concept for risk control purposes. Here is a link to a presentation I made about VRM:
In order to properly develop quantitative strategies using historical data, the best practice is to select and “In-Sample” period to test hypotheses and an “Out-of-Sample” period to test the algorithm on data not used when testing hypotheses. In this case, I used 2000-2013 as the “In-Sample” period and 2014-July 2016 as the “Out-of-Sample” period.
“In-Sample” Results
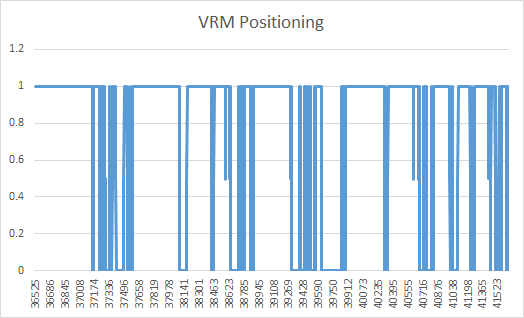
The VRM strategy I tested is a long-only strategy that aims to manage risk by actively adjusting position size. The long. positions produced by VRM are depicted below for the In-Sample period.
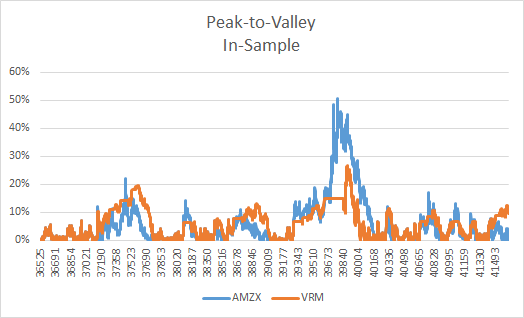
The total return of ALZX during the "In-Sample" period was 1087%, with a maximum drawdown from peak of 51%.
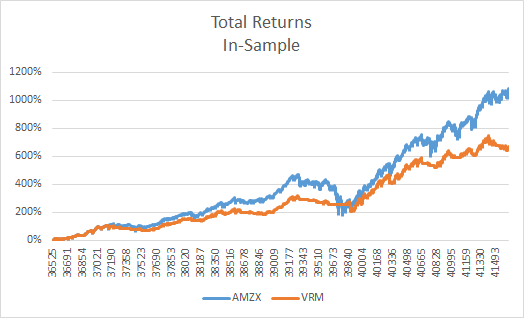
This compares to the total return from the VRM model of 669% with a maximum drawdown of 27%.
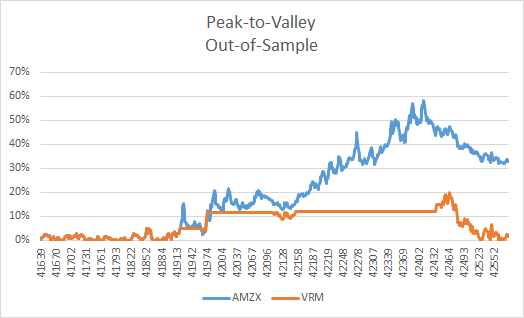
“Out-of-Sample” Results
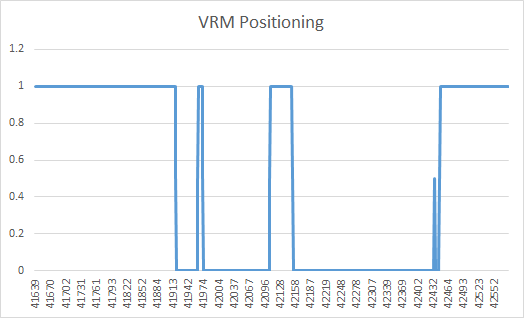
The long/short positions produced by VRM are depicted below for the Out-of-Sample period.
The total return of the Unhedged XLU during the "Out-of-Sample" period was -19%, with a maximum drawdown from peak of 58%.
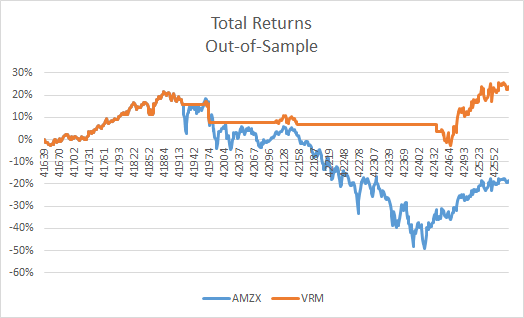
This compares to the total return from the VRM model of 24% with a maximum drawdown of 20%.
Conclusions
The VRM model demonstrates that to achieve good returns in the MLP space within a tolerable loss limit, an investor must be willing to reallocate long positions to cash. Crude oil prices are inherently difficult to predict, but price predictions are not necessary using the VRM algorithm. It is designed to risk-manage when it detects the start of a falling market which may result in a collapse based on the "fear" factor. Equally important, it repositions to a long position after it detects the "fear" regime is over.
Check back to see my next post!
Best,
Robert Boslego
INO.com Contributor - Energies
Disclosure: This contributor does not own any stocks mentioned in this article. This article is the opinion of the contributor themselves. The above is a matter of opinion provided for general information purposes only and is not intended as investment advice. This contributor is not receiving compensation (other than from INO.com) for their opinion.
Important SEC Disclosures: This material is provided for limited purposes. It is not intended as an offer or solicitation for the purchase or sale of any financial instrument. References to specific asset classes and financial markets are for illustrative purposes only and are not intended to be, and should not be interpreted as, recommendations or investment advice. The opinions expressed in this article represent the current, good-faith views of the author(s) at the time of publication. The views are provided for informational purposes only and are subject to change. This material does not take into account any investor's particular investment objectives, strategies, tax status, or investment horizon. Investors should consult a financial advisor for advice suited to their individual financial needs. The author cannot guarantee the accuracy or completeness of any statements or data contained in the article. Predictions, opinions, and other information contained in this article are subject to change. Any forward-looking statements speak only as of the date they are made, and the author assumes no duty to update them. Forward-looking statements are subject to numerous assumptions, risks, and uncertainties. Actual results could differ materially from those anticipated. Past performance is not a guarantee of future results. As with any investment, there is a potential for profit as well as the possibility of loss.
The information presented in this paper relates to the creation and testing of investment models and the use of back-tested performance data. Back-tested results are calculated by the retroactive application of a model constructed on the basis of historical data and based on assumptions integral to the model which may or may not be testable and are subject to losses. Hypothetical performance results have many inherent limitations, some of which are described below. No representation is being made that any account will or is likely to achieve profits or losses similar to those shown. In fact, there are frequently sharp differences between hypothetical performance results and the actual results subsequently achieved by any particular trading program. One of the limitations of hypothetical performance results is that they are generally prepared with the benefit of hindsight. Back-testing allows the security selection methodology to be adjusted until past returns are maximized. In addition, hypothetical trading does not involve financial risk, and no hypothetical trading record can completely account for the impact of financial risk in actual trading. For example, the ability to withstand losses or to adhere to a particular trading program in spite of trading losses are material points which can also adversely affect actual trading results. There are numerous other factors related to the markets in general or to the implementation of any specific trading program which cannot be fully accounted for in the preparation of hypothetical performance results and all of which can adversely affect actual trading results.