

Old wisdom says that patience is the key to success. We can see in the charts below that both metals are in a time-consuming consolidation mode. Only patient traders could survive in this situation as see-saw moves play on our nerves.
Chart 1. Gold Daily
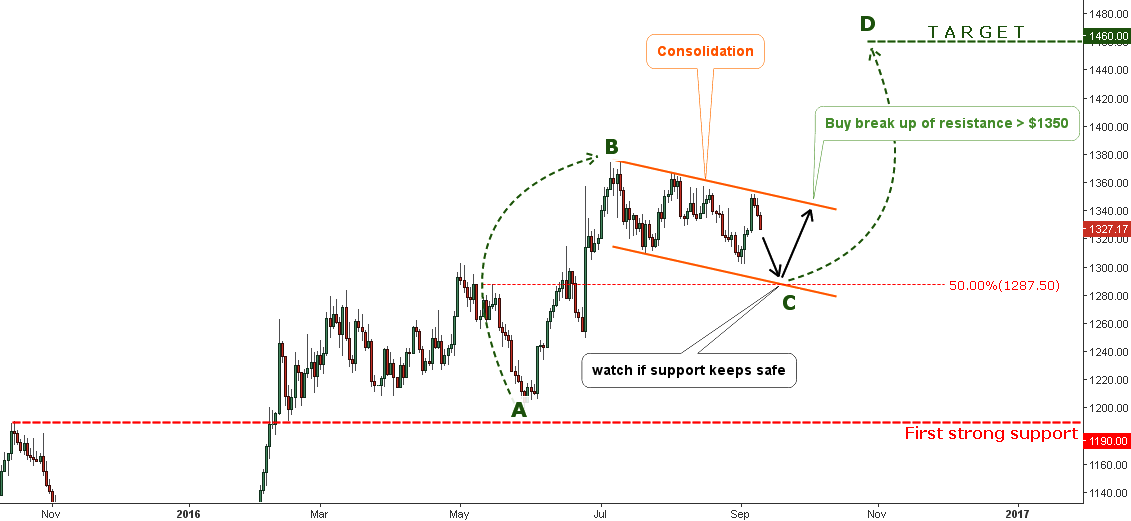
Chart courtesy of tradingview.com
The gold hit a maximum at the $1375 mark this July and couldn’t advance higher. It dropped to the $1310 level at the end of the same month. Another zigzag to the upside was deemed to be a continuation of the bullish move, but it stopped below the July top at the $1367 mark. The next drop hit the $1302 level below the July’s low. The metal has reversed to the upside again and shaped another lower top at the $1352 level last week. I put an orange declining channel to isolate the consolidation for the comfort of your eyes.
As you can clearly see on the chart, it is the sideways move of the price within a $100 range between the $1380 and the $1280 level. The black needle points to the South where the second support of the 50% Fibonacci retracement level and the support of declining orange channel are located. I think we will move that way down before we can see how the market accumulates energy and break the upside of the channel ceasing the consolidation period.
I labeled the upside move from the local low at the $1200 level to the top at the $1375 level as the green AB segment. I expect that market can move higher after consolidation. If we assume that the CD segment will be equal to the AB segment then, the target is set at the $1460 level.
There are two ways to enter the trade – the first is riskier as it is the countertrend and implies the buying on the dip to the support area at $1280-1300 for a potential reversal. You should put a short stop to protect your capital. The second way to enter the trade is to wait until the end of consolidation and buy on the breakup of the orange channel above the $1350 level. It is less risky as you buy with the market. More risk – more profit and vice versa. It is up to you to choose the way you go.
The first downside alert is set at the $1190 level where the former tops and lows are concentrated. Below that level we can see a further drop in the metal price.
Chart 2. Silver Daily

Chart courtesy of tradingview.com
In my July post I made an update of long-term and short-term charts for silver. In the short-term chart the Pennant pattern was detected. Today we can see that the pattern was invalidated as the price fell into longer term consolidation, which is the main topic of today’s post.
Silver has almost the same chart configuration as you have seen above in the gold chart. There are two differences – the expanding structure of the consolidation and the sharper angle of the decline, therefore, the deeper level of retracement. As you can see, the downside of the structure sits on the 61.8 % Fibonacci level at $17.83 making a double support for the price.
The AB/CD concept targets at the $23.15 mark where the CD=AB segment. The conservative buy entry is set on the break above the orange resistance beyond the $19.90 level. The riskier countertrend buy could be made at the drop to the support area within the $17.8-18.0
Intelligent trades!
Aibek Burabayev
INO.com Contributor, Metals
Disclosure: This contributor has no positions in any stocks mentioned in this article. This article is the opinion of the contributor themselves. The above is a matter of opinion provided for general information purposes only and is not intended as investment advice. This contributor is not receiving compensation (other than from INO.com) for their opinion.
Very Nice , True and perfect Technical analysis.
THANKS!