

The background for the copper market is not brighter these days as the macroeconomic data of the top metal consumer - China points at the cooling economy. Asian traders stored up the metal at the start of this year, pushing the price above the $2 mark to a high of $2.3. Nowadays weakening demand puts pressure on copper prices as the Chinese currency hit a 6-year low against the dollar which makes the import more expensive.
Chart 1 Copper Weekly: Support Is At The Gunpoint
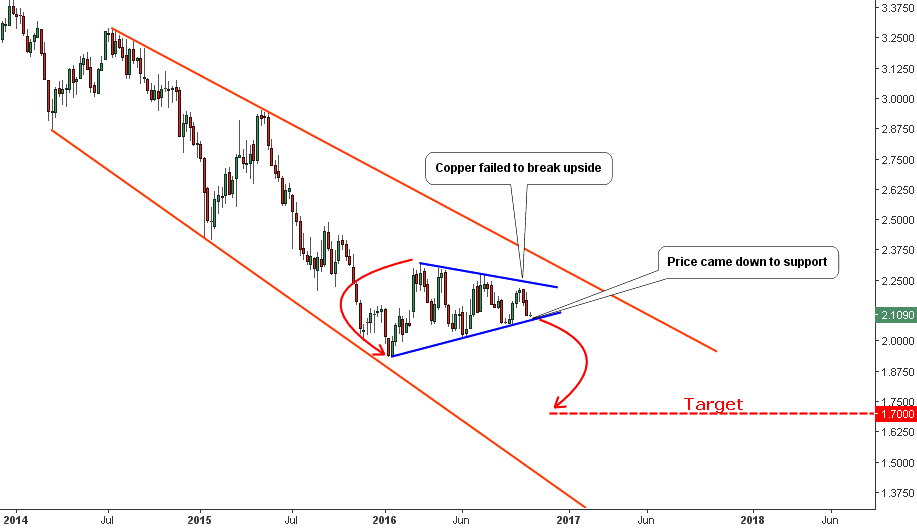
Chart courtesy of tradingview.com
Copper’s price has been descending within an orange expanding downtrend for the past two years. The Contracting Triangle pattern (highlighted in blue) reflects the sideways structure of the market this year.
Last month I set two opposite targets for the triangle according to rules. The market was sitting on the lower side of the pattern, but couldn’t break below it and reversed upside. At the end of September, the price reached the climax point at $2.22 but failed to reach the triangle’s upside and quickly dropped back.
I think that we should carefully watch after the integrity of the downside support at the $2.07 level as this time, the weakening economy could facilitate the breakdown. The target for that collapsing scenario is located at the maximum width of triangle subtracted from the break point. I marked it with the red dashed horizontal line at the $1.70 mark. The previous low at the $2.06 level hit in September would be the next catalyst of the market drop. The invalidation point is too far now above the $2.24 mark.
Chart 2 Freeport-McMoRan Weekly: Broken Shoulder
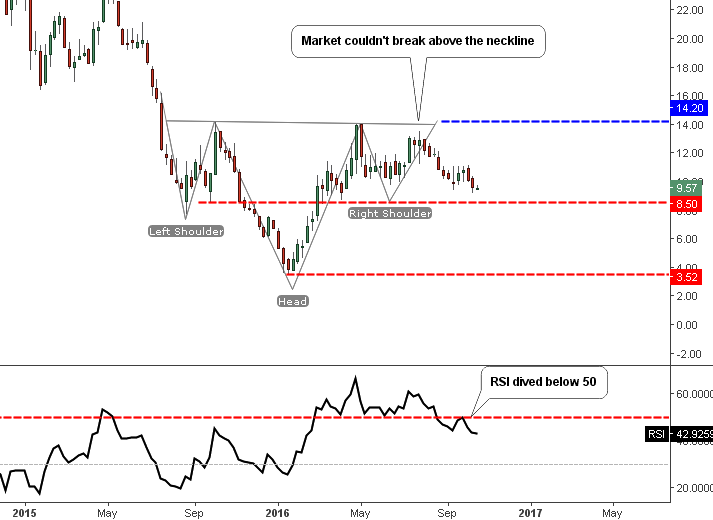
Chart courtesy of tradingview.com
Not all that is beautiful works. The nice symmetric Inverse Head And Shoulders pattern was detected on the chart of Freeport-McMoRan Inc. (NYSE:FCX) in July. I highlighted it in light gray color as it didn’t deliver. The promising large bullish candle was shaped in the middle of July, but the next two weekly candles failed to advance further up beyond the Neckline at the $14.06 mark, though the buy signal was not triggered.
I guess some people bought ahead of the signal and then regretted it. Patience is everything in trading. And if you have a clear plan, then there is not much to be afraid of on the market.
Back to the pattern, the right shoulder was broken at the end, and the price fell below the psychologically strong $10 mark, it was finished there. At the moment there are no tradable patterns or setups on the chart. I would like to share with you some milestones which are highlighted in the chart. The blue dashed horizontal line at $14.2 represents the first strong resistance area where the previous major high was hit a year ago. The two red dashed horizontal lines at $8.5 and $3.52 marks point at the support areas. We are very close to the first support with RSI diving below the 50 level. It indicates the bearish momentum on the market for this stock. I think that if the copper would break below the triangle’s support, the short players will do their job. The next support is way too far for the buyers seek for the stop defense there.
Intelligent trades!
Aibek Burabayev
INO.com Contributor, Metals
Disclosure: This contributor has no positions in any stocks mentioned in this article. This article is the opinion of the contributor themselves. The above is a matter of opinion provided for general information purposes only and is not intended as investment advice. This contributor is not receiving compensation (other than from INO.com) for their opinion.
"Patience is everything in trading. And if you have a clear plan, then there is not much to be afraid of on the market." Thank you Aibek. I'm typing that one up in large print and putting it on the wall : )
If you want to be secret, you will be small until some one can't hug it around and big can't see