

The current situation in the precious metals markets very well illustrates how patience in trading can save money for the trader. It means that a trader who waits for the confirmation of the price action has an ample advantage compared to those who choose assumption mode entering the market without confirmation. In other words, the ‘trade what you see’ method is way safer than the ‘trade what you assume’ method. For many years in trading, again and again, I see how true the words said above, especially during market consolidations.
The corrective chart structures are unpredictable though very dangerous, especially for newcomers. As I wrote earlier such structure shows the market’s indecision with a lot of hesitant zigzags which have no clear ending point both in time and in the price level and therefore are risky.
Last month in the Gold and Silver post I said that only patient traders could survive this corrective structure of the market as later you witnessed the sudden severe drop of the metals below projected supports. And those who tried to ‘catch the falling piano’ got smashed quickly and easily. On the contrary, those traders who kept a keen mind and waited for the break above the resistance are still not in the game and wait for the confirmation of reversal, which is yet to appear.
Gold Daily Chart
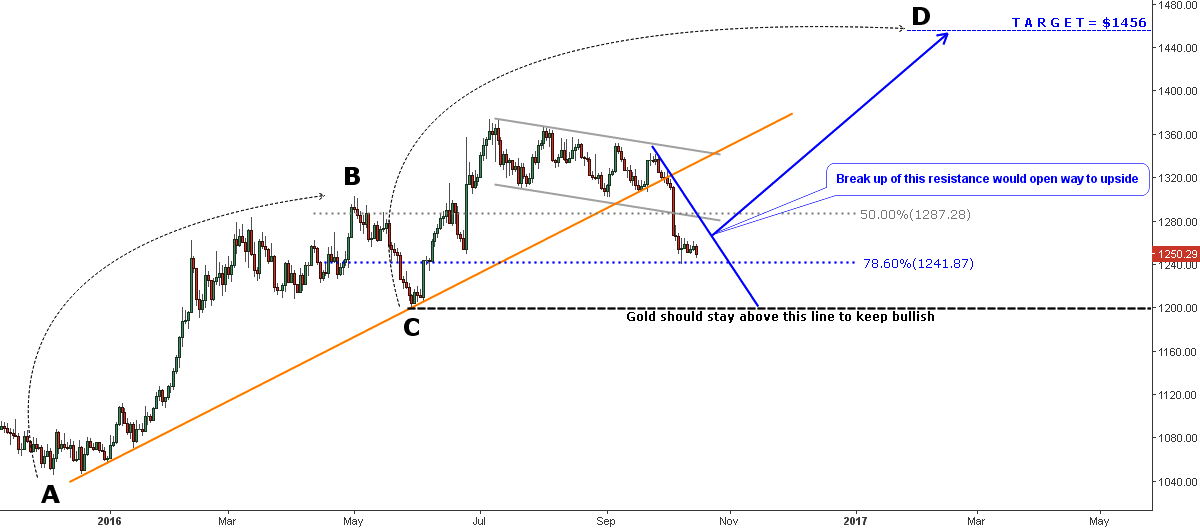
Chart courtesy of tradingview.com
I put elements of the previous post chart in light gray color to show you how tricky corrective structures can be. The mild incline of the gray corrective downtrend was promising for the bulls as they were ready to buy all dips as they did with the touch of an orange trendline support.
The bounce to the upside was short-lived and then the price of gold fell like a stone below the orange trendline support breaking deep below both the gray channel support and the 50% Fibonacci level. I added the last retracement level at 78.6% Fibonacci ratio (blue dotted line) at the $1241 mark, by the way, it is the most common correction level for deep retracements. Again, we can witness the power of this mathematical ratio – the low on the 7th of October was right at the same level at $1241. But this is not the end yet. The price has been stuck in a $1241-1265 range, which can be the lower degree consolidation before another drop down, probably the last one as we have a small room between the 78.6% level ($1241) and the full 100% retracement ($1199).
We should wait and see if another leg of correction is finished for this purpose I put the blue vertical trendline resistance. Only when the price would break up this line, we can hope for the start of a reversal to the upside.
Last time I tried to find the target for the anticipated upmove using the low projected from the gray supports on the chart. The price of gold dropped lower invalidating the threshold of the CD segment at the earlier post. As I said at the beginning of this post – the assumed level is less reliable than the confirmed or settled price levels.
This time, I applied the AB/CD concept segments to the chart with a black color, using three actual points: two lows and one top. The AB segment consists primarily of the sharp straight move up while CD segment’s first leg up is a wide zigzag, which can be read as hesitation among buyers. If CD=AB then the target can be hit at $1456 level, which is $27 below the 50% Fibonacci level depicted on the monthly chart this August.
The price should stay above the May’s low at $1199 to keep bullish, if not, then we should put a new retracement net from the major low at $1046 to the recent high at $1375 to trace a larger correction.
Intelligent trades!
Aibek Burabayev
INO.com Contributor, Metals
Disclosure: This contributor has no positions in any stocks mentioned in this article. This article is the opinion of the contributor themselves. The above is a matter of opinion provided for general information purposes only and is not intended as investment advice. This contributor is not receiving compensation (other than from INO.com) for their opinion.
Well-written article Aibek
Now, future of Gold is depends upon:-
Bellow $ 1220 and above $ 1320 this is the nearer Trading range, so further direction will be decided under or above range, otherwise, market will pass through side-way movement.
all speculations are in vain
nobody knows what gold will be doing
Dear Dan,
Thanks feedback, please check my earlier posts, if you find any trouble to get it, you may ask therefore with your email id so that i can provide you through mail.
Regards,
Rasesh