

Everything in our world consists of uncountable invisible parts. It looks like a Great Constructor builds everything thoroughly copying and pasting the smallest parts of every single thing connecting it into something big and meaningful let it be living or non-living things.
And so are the market trends as they consist of the smallest tick trends, which are invisible on higher time frames. But when these ticks are built stable into one direction it makes a megatrend like the house is being built of small bricks. Top metals are now building an uptrend, which consists of smaller ones which I would like to highlight for you today in updated daily charts below.
Chart 1. Gold Daily: Target = Resistance
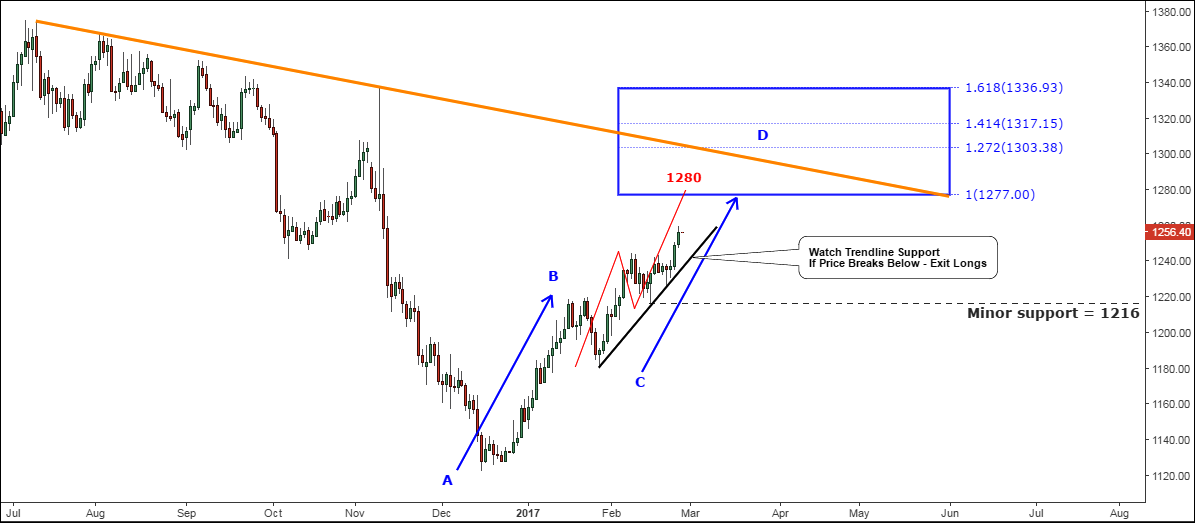
Chart courtesy of tradingview.com
The gold successfully surpassed the previous top ($1221) mentioned as a resistance in my previous update. Reaching a fresh high on the 8th of February at $1245 it dropped back to the breached point and slightly dipped below it to $1216 level. After that we saw a new upside move, which took off the minor resistance at $1250 just last Thursday and the next day the metal confirmed the break hitting the fresh high at $1260. The next very strong double resistance was set in my earlier post at $1305 level.
This time I applied the AB/CD concept (blue) to get accurately calculated targets for the current move to the upside as we have now two distinct segments after price broke above the consolidation area. Why is it so important now? Because the second segment would finish the first large upside move and we should expect a larger consolidation after that, which could push the price of the gold lower and better book profit ahead of it to keep gains.
The range for the D point is set within the $1277-1336 range using the Fibonacci ratios (1-1.272-1.414-1.618) as highlighted in blue rectangle in the chart above. The first target is just $21 away from the market close. The next target at $1303 level (ratio = 1.272) is located right in the mentioned above double resistance area where the orange trendline and the previous consolidation area cross. The other targets reflect the breakup of the orange trendline.
In the preamble to this post I wrote that everything complex consists of smaller parts and so is the trend in the market. I added the small red zigzag to show you that the CD segment also consists of two smaller segments and the minimum target for it is located at $1280 mark, which confirms the minimum target for the large blue CD segment set at $1277. Amazing magic of numbers!
The black support trendline, which was put under the CD segment, is the signal line. Once the price breaks below it would be better to exit longs to keep the profit.
Chart 2. Silver Daily: “Ace In The Hole”

Chart courtesy of tradingview.com
This top metal was the first to break out of consolidation and the first to reach the strong resistance (red). Besides that, it came the first to the minimum target at $18.33 level, which was set for the D point where the CD=AB segment.
The rest of the possible targets are located within the $18.78-19.37 range as per Fibonacci ratios. There is also an Inverse Head & Shoulders pattern’s target at the $18.90 mark in between.
We should watch closely the black trendline support under CD segment to have time to jump out of the market before the larger correction appears.
And that’s not all for the silver. The metal has a more clear technical graph than the gold and therefore we can find more interesting and sometimes exotic patterns on its chart. The red expanding channel is nothing else than the Descending Broadening Wedge pattern. And this is that very same hidden “Ace In The Hole” as gold doesn’t have this pattern in its chart.
It puts the silver in the pole position ahead of gold as the target for it is much higher than we set before in our daily charts. It is located at the top of the pattern at the $21.13 mark as highlighted by the red dashed horizontal line. None of the D points are approaching that level and it means that this target would be hit during the next larger leg upside. Before that we could witness a deep consolidation.
Intelligent trades!
Aibek Burabayev
INO.com Contributor, Metals
Disclosure: This contributor has no positions in any stocks mentioned in this article. This article is the opinion of the contributor themselves. The above is a matter of opinion provided for general information purposes only and is not intended as investment advice. This contributor is not receiving compensation (other than from INO.com) for their opinion.
Great chart which I planned to follow when the metals hit their targets. But, three days later, the metals and miners are in the tank with me with them
Good analysis - might be helpful to incorporate Elliott Wave theory in your analysis also, if you happen to use that.
Thanks!