

Over the past three years, a dark cloud has been looming large in China—a massive debt bubble. It seems that, with each bit of good news, whether it’s GDP growth hitting 6.9% for the second quarter in a row, exports climbing to 7.2% Year on Year or Retail Sales surging by 10.4%, the dark cloud of a looming debt crisis grows darker and more menacing. So, when investors suddenly find their appetite whetted for Offshore Chinese debt, one should sit up and take notice.
Chinese Offshore RMB bonds, amusingly nicknamed Dim Sum bonds, are relatively new in the market, existing only since 2007. The Dim Sums’ appeal is, that they trade on offshore markets, rather than in mainland China, thereby allowing investors to buy Chinese debt without the risk of interference from Chinese regulators. As a result, the performance of Dim Sum bonds reflects the sentiment of Chinese debt more accurately.
One convenient way to gauge Dim Sum bonds is via the PowerShares Chinese Yuan Dim Sum Bd ETF (DSUM), which tracks the Citi Custom Dim Sum Bond index. Roughly 80% of the funds are invested in Chinese corporate bonds; among its top holdings are the two real estate giants Greenland Hong Kong Holdings and Lai Fung Holdings, Lenovo Group and Asian Development Bank.
As can be seen in the chart below, from June 2015 until January 2017, Dim Sum bonds were in a bearish cycle. Chinese new homes prices reversed gears, initially surging a staggering 10% year-over-year in January 2014 then falling more than -5% in March of 2015. After the PRC imposed strict regulations on housing purchases and clamped down on China’s shadow banking industry, the real estate bubble seemed ready to burst finally. Banks were hit with loan losses, and the even bigger bubble in credit markets (which fueled the real estate hype in the first place), seemed to be on the verge of a brutal end. Foreign investors were simply offloading Chinese debt and fleeing from risk.
And yet, as can be seen in the DSUM chart, things changed from January 2017. Dim Sum bonds recovered and, in fact, have been on a bullish trajectory ever since. What changed? Inflation.
Globally, inflation took a nose dive, and the story was no different in China. From a headline inflation rate of 2.5% back in January to the current low of 1.4%. It is important to note that the headline inflation rate in China excludes home prices and takes into account only rent, thus it does not capture the recovery in home prices of the past months In 2016, the Chinese State Council (Equivalent of a Government) alongside the People's Bank of China (China’s central bank) had already deployed aggressive measures to stave off the crisis in 2016. Those measures included aggressive rate cuts, from 6% to 4.35%, liquidity injections in billions of Yuan by the People Bank of China to the banking system to increase liquidity. And finally, capital restrictions to avert capital flight. In fact, the Chinese Communist Party formed a special committee charged with increasing liquidity and transparency in the banking system, which has helped ease tensions. Once inflation fell, investors were confident that People’s Bank of China could keep the easy policy in place, rather than cause more worry about inflation. Moreover, lower inflation tends to reduce volatility. Taken together, that has helped to calm investors who have not moved to reassess their outlook for China. No longer is China set for an ugly bubble burst; rather, it’s embarked on a well-managed deleveraging cycle.
Is The Tide Turning Again?
When it comes to China, there are two certainties: calmness is the extraordinary and volatility is the ordinary. And when things are quiet for too long, one must expect volatility to come back with a vengeance. And what brings back volatility? Inflation, and with inflation in China bottoming out from February to May. Couple that with the S&P Goldman Sachs Commodity index which has surged by 7.2% since June, signaling that global inflation is crawling back higher, and taking Chinese inflation with it. And the DSUM ETF? It has already topped out at 23-24$, the level at which its massive selloff started, signaling that calmness has passed and Chinese volatility is, once again, ready to make a comeback.
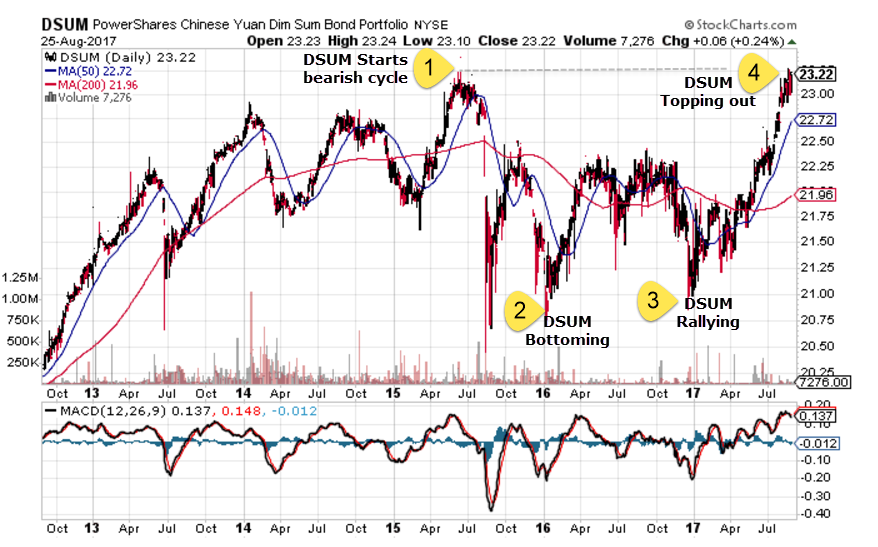
Chart courtesy of Stockcharts.com
Look for my post next week.
Best,
Lior Alkalay
INO.com Contributor
Disclosure: This article is the opinion of the contributor themselves. The above is a matter of opinion provided for general information purposes only and is not intended as investment advice. This contributor is not receiving compensation (other than from INO.com) for their opinion.
A friend of mine said to me if I ever feel uncomfortable about a position, then I am either trading too big or I am married to my expectation of an assumed outcome.
Don't forget to always protect your capital!