

If you have read my last update on this metal, you should be aware of a recent miscorrelation between the two core assets. You will see in the chart below that my bold expectations for a rapid recovery of oil didn't come true.
Chart 1 Copper-Oil Comparative Illustration: Investors Choose Metal Over Oil
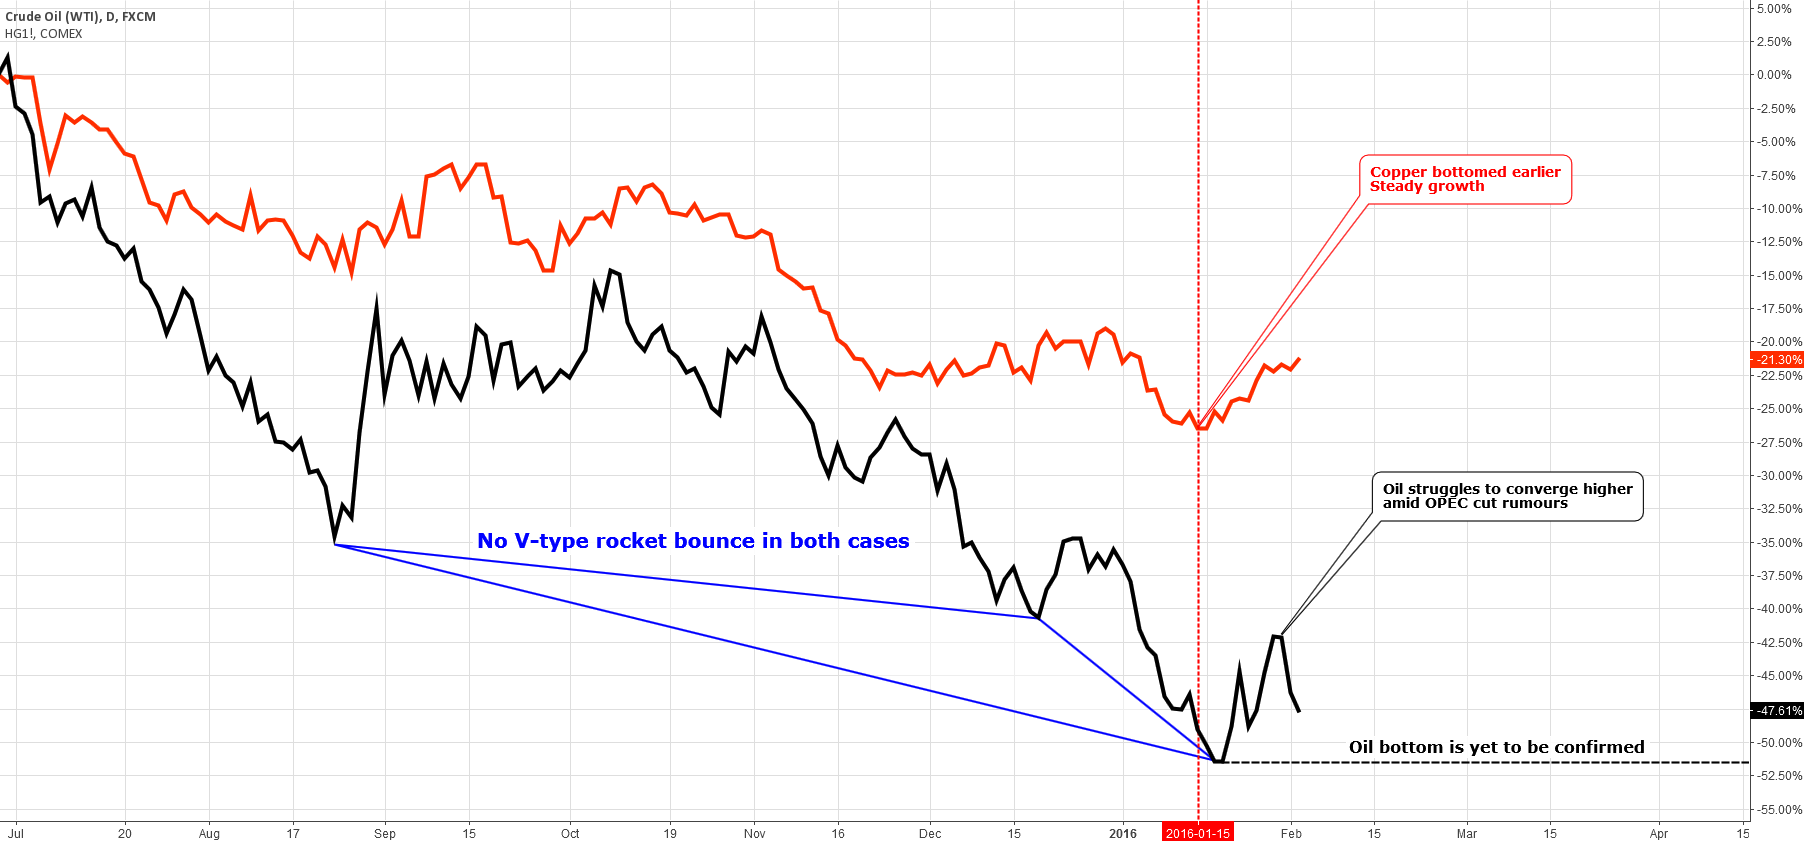
Chart courtesy of tradingview.com
Neither the first interim low in the middle of December nor the second low in the middle of January could make the much anticipated V-shape rocket reversal. The main reason for that is the oversupply of the oil market. There are rumors that OPEC will soon reach a deal with Russia to cut production for their mutual benefit. This, of course, will cause the price of oil to rise. I think this is a temporary measure and after the short-term rise we will see the price of oil drop again, but it could take some time happen.
In the chart above I highlighted the current bottom of copper's price by the red dashed vertical line. The metal reversed course earlier than oil did. Copper growth looks firm and steady while oil is struggling to get over the $35 mark.
However, one thing is back to normal – the correlation, both instruments are moving in the same direction. If oil manages to close above the $35 mark for the month, we shall rely on the previously mentioned $43-45 price target to be reached as oil should close the gap with the metal.
Below I reconstructed the chart from the previous update with a set of fresh remarks in red callouts.
Chart 2 Copper Monthly: Did Anyone Buy The Dips?
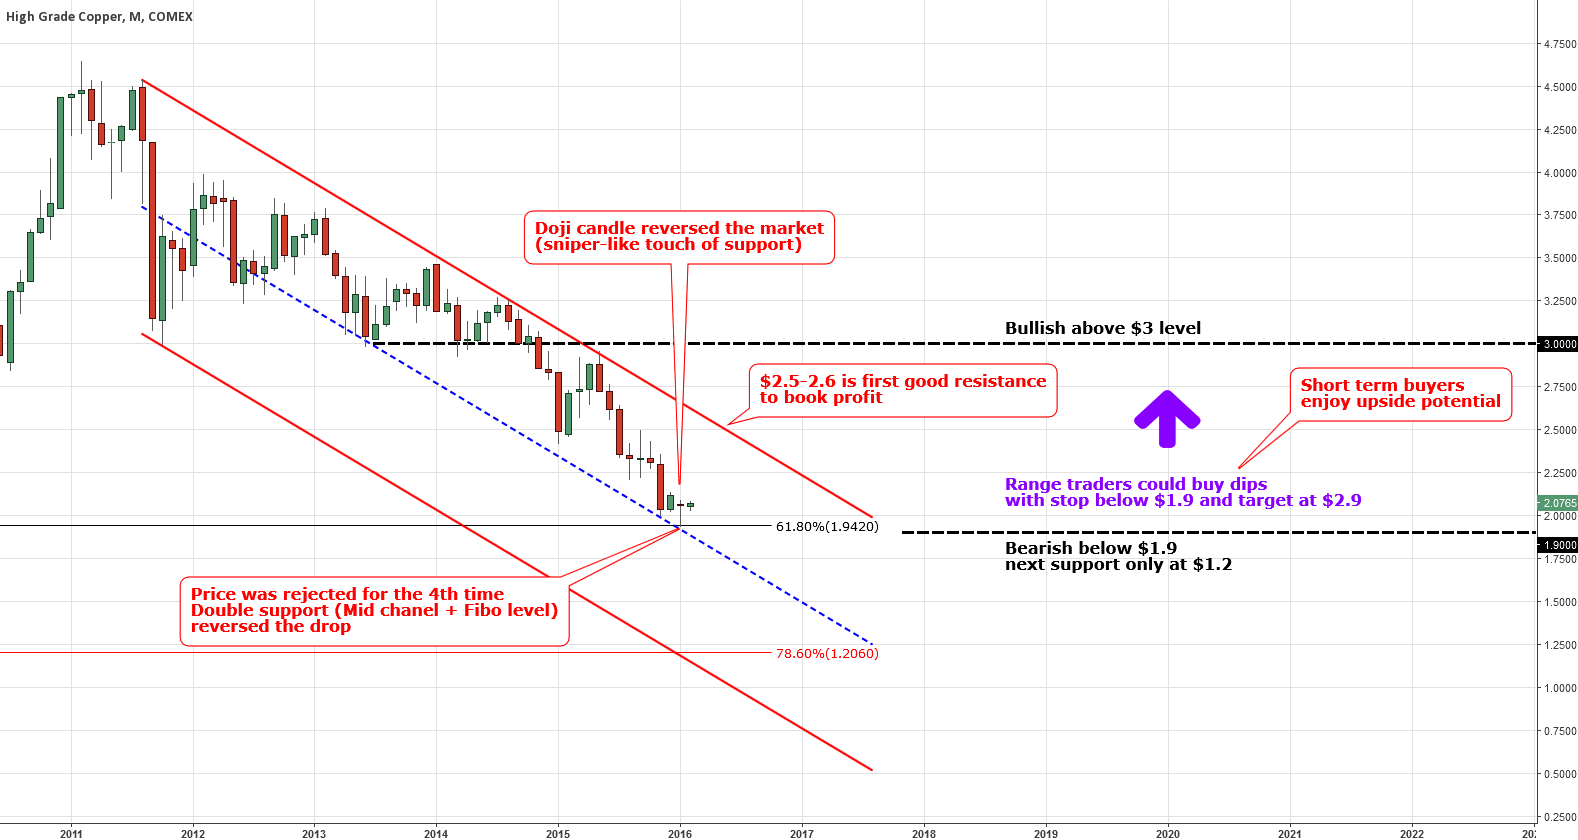
Chart courtesy of tradingview.com
Double support of 61.8% Fibonacci level and the middle of the channel justified expectations and reversed the price upside. It was really a sniper action: metal's bid at the low was $1.937 and the support is located at $1.942, just half a cent overshoot.
January price action shaped the famous "Doji" reversal candle (open and close are almost equal) on the monthly chart. Indeed, copper has turned higher so far! For the final confirmation we need a February close over $2.12 (December high).
My congratulations to those range traders (short-term buyers) mentioned in my last update who bought on the dips. Now you can move your stop to break even or to more comfortable levels. I would recommend you to cover longs at $2.5-2.6, where the September high and the upside of the downtrend cross to watch if the market can break it up.
The medium term plan is still intact: watch 1.9/3.0 margins for the break to follow the trend.
Intelligent trades!
Aibek Burabayev
INO.com Contributor, Metals
Disclosure: This contributor has no positions in any stocks mentioned in this article. This article is the opinion of the contributor themselves. The above is a matter of opinion provided for general information purposes only and is not intended as investment advice. This contributor is not receiving compensation (other than from INO.com) for their opinion.
Aibek, you did not answer my questions about your favored crypto Bitcoin !!
VERY GOOD WORK SIR