

This post is dedicated to silver as the projected period of consolidation set in my previous Gold & Silver post finished last week on Tuesday, the 18th of April. Let’s see the result of that “Cloning” experiment below.
Chart 1. Snapshot Of Experiment Result: Good Range Wrong Timing
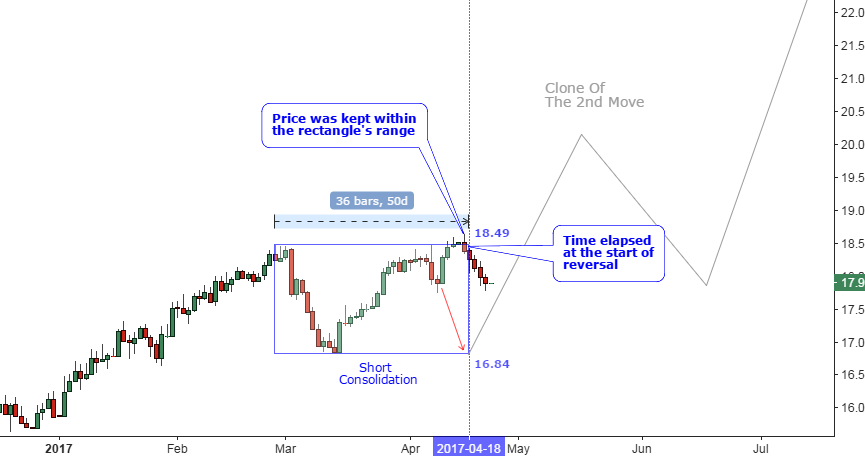
Chart courtesy of tradingview.com
The chart above is a snapshot of the projected graph within the “Cloning” experiment posted earlier. As we see the price didn’t follow the red down arrow and reversed higher up to the top of the rectangle where it was blocked successfully. And the anticipated down move started right at the end of projected period missing the time target.
The result of the experiment is mixed – the price range kept safe as the time range exceeded the given period. The reason is the different chart structure of this second move up. Cheer up, another chance is underway in the next chart.
Chart 2. Silver Daily: Correction Time Could Be Over Soon

Chart courtesy of tradingview.com
The silver price broke above the trendline resistance (orange) and retested it in the pullback at the start of April. The bounce up was limited and another pullback is underway.
I applied time clones again, but used nearby moves to determine the range for this pullback. This time there is a proportional cloning as the upside move started at the end of last December is way larger, than the upmove started this March.
The large upmove spent 49 candles (blue) before the drop, which in its turn took 12 candles (red) to get completed. I divided 12 to 49 and the outcome is 0.25, this ratio I applied for the small move, which took 23 bars (blue). The projected drop could last for 6 bars (red) and should finish on Tuesday, the 25th of April as highlighted in the red vertical line.
I added the black support line charted through the higher lows. And this completes the picture. Now we have a time and price confluence area highlighted with the blue ellipse. It could offer a good buying opportunity as double support and time projection are located here within the $17.4-17.6 range.
Let’s look through the “microscope” of the lower time frame in the last chart below to spot more clues.
Chart 3. Silver 4-Hour: Watch Downtrend And Fibonacci Retracement area
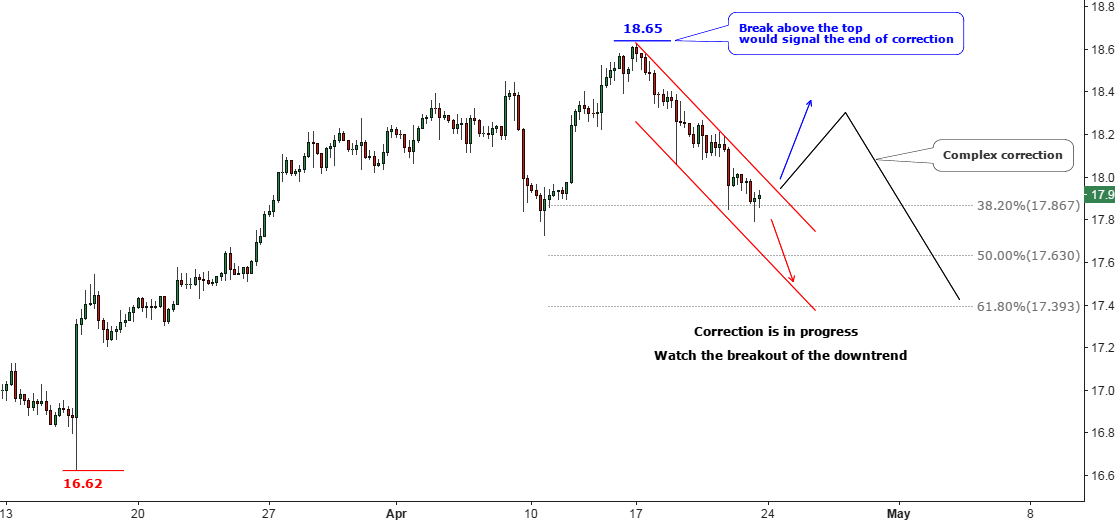
Chart courtesy of tradingview.com
The above chart is the zoomed in picture of the last upmove and the current consolidation within the $16.62-18.65 range.
The correction is contoured with the red downtrend. It pierced the initial 38.2% Fibonacci retracement level at the $17.87 mark. Quite often it is not enough and we should be ready to see the lower price level, which could reach 50-61.8% retracement within the $17.39-17.63 range, which confirms the ellipse borders in the Chart 2.
You could draw the same downtrend and watch if the silver breaks out of it. It could be the first buy signal. I added the gray zigzag to highlight the possible complex correction (I hope you remember that corrections are tricky). The buyers could sigh with relief only when the price would break above the last top at the $18.65 mark.
The target for the upside move in silver was set in my February post at the $21.13 mark (Descending Broadening Wedge) and it is still intact.
Intelligent trades!
Aibek Burabayev
INO.com Contributor, Metals
Disclosure: This contributor has no positions in any stocks mentioned in this article. This article is the opinion of the contributor themselves. The above is a matter of opinion provided for general information purposes only and is not intended as investment advice. This contributor is not receiving compensation (other than from INO.com) for their opinion.