Silver Update: Roller Coaster Ride

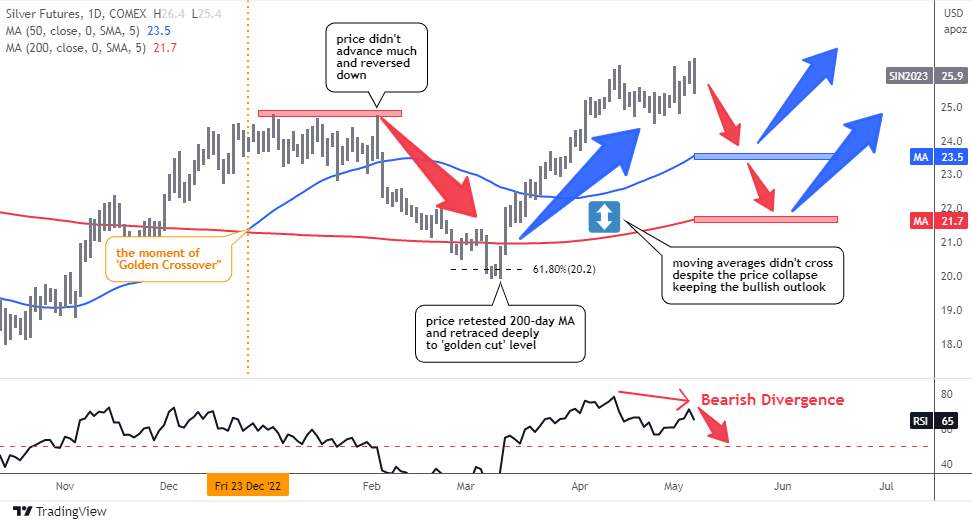
The previous post “Golden Pattern For Silver, Not Gold” from December highlighted a bullish pattern called the 'Golden Cross' that appeared on the daily chart of silver futures. This occurred when the 50-day moving average crossed over the 200-day moving average.

While the majority of readers considered this signal to be reliable, they did not expect the price of the metal to rise above $30.

The following daily chart will show how the pattern has played out since then.

Silver Futures Daily

Source: TradingView

When the ‘Golden Cross’ signal was posted, the price of silver futures was at $23.9 (marked by the orange vertical line), and it went up almost $1 to reach $24.8 before stalling for over a month.

The price was unable to break above this new high and subsequently collapsed, dropping below the blue 50-day MA and testing the red line of the 200-day MA, briefly breaking through to reach the ‘golden cut’ Fibonacci retracement level of 61.8% at around $20. Continue reading "Silver Update: Roller Coaster Ride"

As Banks Collapse, Start Looking Ahead

Almost two months ago, I wrote about how you could buy exchange-traded funds, both long or short, to play what, at the time, we were told was a one-off banking crisis with just Silicone Valley Bank.

The point at the time was that it was unlikely that Silicone Valley Bank was the only bank that took on outsized risks, and therefore it was unlikely they would be the only bank that would have problems.

Fast forward almost two months. We have had three banks, Silicone Valley included, fail in the U.S., and Credit Suisse needing a loan from the Swiss Nationals bank. We have also, more recently, had several bank stocks take massive noise dives as investors fear they are the next bank to fail. And we even had Pacific West Bank announce that they are looking at potential sale options and strategies to sure up the company.

We can all sit here and believe what Janet Yellen and Federal Reserve Chairman Powell tell us about the financial sector's health and go on with our day.

But, while the overall financial sector may very well be as healthy as they claim it is, a lot of banks, both big and small, are seeing their stock prices tank. And as an investor, when I see this type of price destruction, I immediately think, "Am I missing a good or even great investment opportunity while this plays out?"

As I said two months ago, I can't tell you if the banks will go higher or lower in the near future from where they sit today; I am not that intelligent.

But I know that the big banks, not the regional ones, will survive this crisis in the long run. And, based on history, i.e. the 2007-2008 financial crisis, the big banks are likely to get even more significant.

If anyone thought the big banks were "too big to fail in 2008," they are even more prominent today. Hence, they are indeed too big to fail today.

Furthermore, since the bank was failing, JPMorgan Chase just bought most of First Republic Bank's assets. That move has made JPMorgan even larger; big banks are getting even bigger. Continue reading "As Banks Collapse, Start Looking Ahead"

"Dr. Copper's" Prescription Proves Effective

In February, I presented my analysis of copper and gold/copper price trends in a post titled, Dr. Copper Prescribes Gold. Now, it's time to update both charts.

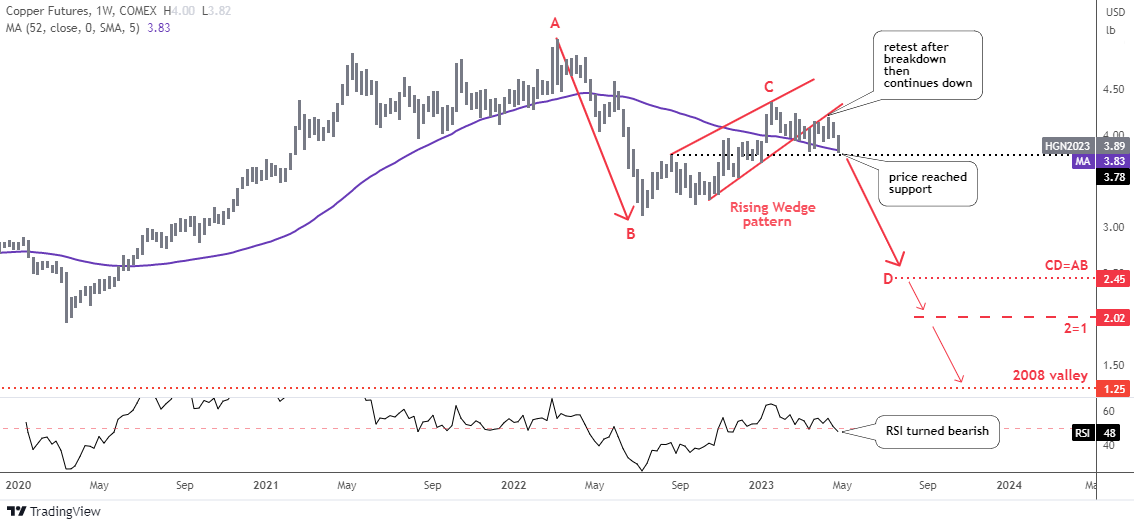
In the previous analysis, most readers preferred a conservative outlook for copper futures prices, predicting a drop to only the equal distance in the CD part, which is $2.45. Since then, the price has declined, but not as rapidly as anticipated.

Let me show you the updated copper futures chart below.

Copper Futures Weekly

Source: TradingView

As expected, the price action on the Rising Wedge pattern's support played out in textbook fashion, with the price breaking below it and then spiking up to retest it before continuing its downward trend.

The price has now reached a double support zone formed by the purple moving average and the black horizontal trendline, between the $3.78 and $3.83 levels. Continue reading ""Dr. Copper's" Prescription Proves Effective"

Tesla (TSLA) - How Should You Play It?

Shares of Tesla (TSLA) are once again giving traders big daily moves. After the stock hit a 52-week low of $101, it bounced back above $210, and now it appears to be heading lower again.

The catalyst for the move lower was primarily the company's most recent earnings report, which, despite sales, revenue, and earnings all coming in strong, margins took a hit.

Tesla has dropped prices on its vehicles five times over the last year, so margins taking a hit should not have been as much of a surprise as it was to the market.

However, Tesla still has a strong market position and is still producing industry-leading margins. The issue is that those margins are shrinking, and at some point, Tesla may see its margins fall more in line with the rest of the auto industry.

We have seen these types are situations play out in other sectors as companies grow and mature. The best example I can think of is Whole Foods.

When Whole Foods was a young, fresh company, it commanded upwards of 5% margins on its products. But, as the company grew and the rest of the grocery industry noticed what Whole Foods could do with selling premium products and commanding higher margins, other grocery store chains began to offer similar products.

This competition for the customer naturally puts pressure on Whole Foods' margins, thus forcing them to lower prices and lose their high margins.

I believe the same story is now playing out with Tesla. At this time, it is clear that the world is moving away from combustion engine vehicles, although slower than some would like. And as consumers move towards more electric vehicles, more companies are offering alternatives to just buying a Tesla. Continue reading "Tesla (TSLA) - How Should You Play It?"

2 Gold Stocks Likely To Outperform

While the Nasdaq 100 (QQQ) has continued its outperformance on the back of a strong start to the Q1 Earnings Season for Big Tech, the real outperformer has been the Gold Miners Index (GDX).

Not only is the index outperforming the major market averages with a 17% return but it’s also outperforming the price of gold, a healthy sign that suggests a potential change in character after years of underperformance.

The recent strength can be attributed to the sharp rise in the gold price towards the psychological $2,000/oz level, resulting in significant margin recovery for gold producers after a tough year plagued with supply chain headwinds and inflationary pressures.

The good news regarding the recent rally in the Gold Miners Index is that momentum is to the upside and sharp pullbacks are likely to find buying support.

The bad news? With the index up over 50% from its Q3 2022 lows, some of the easy money has been made and a few miners are actually looking fully valued.

Fortunately, there are exceptions, and in this update we’ll look at two names that look reasonably valued and are likely to outperform given their relative value compared to peers.

Marathon Gold (MGDPF)

Marathon Gold (MGDPF) is a development-stage gold company based out of Newfoundland, Canada, with the company currently busy constructing its Valentine Gold Project.

The project is home to nearly 3.0 million ounces of gold reserves and the company plans to operate an open-pit mine consisting of three pits (Berry, Valentine, Leprechaun) with average annual production of 195,000 ounces of gold (first 12 years) at industry-leading all-in sustaining costs of $1,007/oz.

Based on the current schedule, Marathon is aiming to start producing gold by year-end 2024, and the project should boast ~48% margins and generate $120 million per annum in free cash flow at a $1,950/oz gold price. Continue reading "2 Gold Stocks Likely To Outperform"