Is The Gold Rush On?

Today, I'm going to be focusing on gold (FOREX:XAUUSDO). It would appear as though this market had a number of cycles that are coming due and some that have just passed. It also looks as though all of the problems in the world haven't had any real powerful effect on gold. Normally in times of uncertainty, gold has been the go-to asset for most investors, but for some reason, not this time.

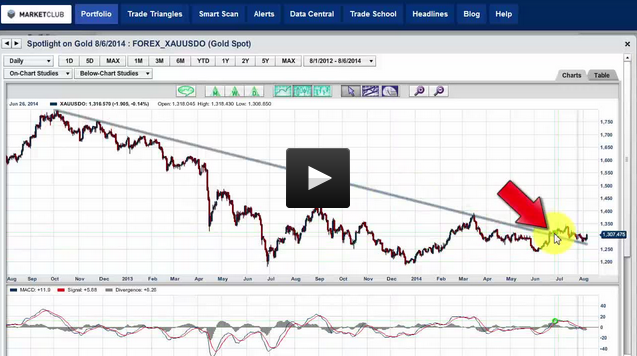
With today's strong upward market action, there have been a couple of technical indicators click over to the upside, these indicators are the forerunners of a larger, more extended move to the middle of September. By mid-September, gold could be trading at the $1,420-$1,430 level, if all of the technical indicators line up.

For many traders, gold has been somewhat of a disappointment in 2014, even though it is plus some $70 for the year. Many gold bugs were expecting much higher levels by this time, given all of the uncertainties with the banks and conflicts around the world.

The next 4 to 6 weeks could be very exciting in this precious metal and I expect this excitement to come in the form of a move to the upside. In this detailed video, I will show you exactly where the cycles are, plus the technical indicators that I'm watching closely for further confirming evidence that a bull move is underway.

Every success with MarketClub,
Adam Hewison
President, INO.com
Co-Creator, MarketClub

Is Netflix Inc. (NASDAQ:NFLX) Streaming To Go Higher?

Today, I'll be taking a in-depth look at the stock of Netflix Inc. (NASDAQ:NFLX). The stock enjoyed a very nice move from May through July, but has since stalled out. After making a high in July, the stock has pulled back from the $472 level to where it is currently trading around the $427 level.

Netflix was founded by Reed Hastings, who had the brilliant idea of sending DVDs through the mail directly to your home. This was a disruptive idea at the time, which put many mom-and-pop video rental stores out of business. Now Netflix is expanding and streaming videos directly to your computer, bypassing the post office, which is even a better idea, in my opinion.

Netflix has to be the undisputed leader in entertainment/streaming video field, but now has lots of competition in the form of Hulu, Amazon, Apple and many others. My thoughts are that Netflix will continue to be the major player and continue to own the major portion of the video streaming business. Continue reading "Is Netflix Inc. (NASDAQ:NFLX) Streaming To Go Higher?"

John Hathaway and Doug Groh: Buy Gold Like It's 1999

The Gold Report: In a 4th of July investor letter, you wrote that the precious metals complex, both mining shares and bullion, appear to be in the process of completing a major bottom, and you're more comfortable with the proposition that the downside potential has been fully exhausted. What are the signs that it's really turning this time?

John Hathaway: The gold futures chart is showing that we are in the process of a reverse head-and-shoulders pattern, which is a sign that a bottom has been completed. It means that downward momentum has been exhausted. This bottom will be confirmed when gold trades above $1,400/ounce ($1,400/oz), which is a stretch from where we are. At least we can say fairly credibly that it's shaping up to be a bottom, but we may test it over the summer.

Source: International Strategy Investment Group LLC

TGR: Are statistics on money flows telling you that investors are starting to get interested again? Continue reading "John Hathaway and Doug Groh: Buy Gold Like It's 1999"

Keep Your Eye On First Solar, Inc. (NASDAQ:FSLR) Today

One interesting stock to keep your eye on today is First Solar, Inc. (NASDAQ:FSLR), which broke over a long-term downtrend line in October 2013 and has been moving sideways, but slowly inching upwards nonetheless.

Today's market action in this stock is going to be important because if it closes towards the highs of the day, somewhere around $64.00 as of this writing, a Japanese candlestick "morning star" formation will be created. This can be a strong indication of a reversal to the upside.

This stock has also made a double bottom at $60.75 and again at $62.58. On both the monthly and weekly charts, the RSI level remains above 50, indicating that the longer term uptrend is still intact. This coincides with the monthly Trade Triangle, which remains green and positive. Continue reading "Keep Your Eye On First Solar, Inc. (NASDAQ:FSLR) Today"

The Stock Market with Elliott Wave Labels from 1693 to Present Day Reveals a Bear Market Formation Since 2000

By: Elliott Wave International

The following article was adapted from Robert Prechter's June 2014 issue of The Elliott Wave Theorist, one of the longest-running investment letters in the business, continuously published monthly since 1979.

Figure 1 shows the stock market's waves from 1693 to the present. The circled Roman numerals denote waves of Grand Supercycle degree, the largest complete waves for which stock market data exist.

Wave I (circled) ended in 1720 at the peak of the South Sea Bubble in England. Wave II (circled) took the form of a zigzag, labeled (a)-(b)-(c); it ended in 1784. Third waves are usually extended, meaning they are longer than wave one and have clear subdivisions. This is exactly how wave III (circled) developed. It ended in 2000.

Wave III (circled) subdivides into five waves. Wave (I) ended in 1835, wave (II) in 1859, wave (III) in 1929, wave (IV) in 1932 and wave (V) in 2000.

Wave (V) subdivides into five waves, as illustrated in Figure 2. Wave I ended in 1937, wave II in 1942, wave III in 1966, wave IV in 1974 or 1982, and wave V in 2000. Continue reading "The Stock Market with Elliott Wave Labels from 1693 to Present Day Reveals a Bear Market Formation Since 2000"