Gold Has Repeated Bullish Pattern

Back in February, I shared with you an updated monthly chart of gold futures with a completed Cup & Handle pattern just ahead of a potential breakout above the preset trigger.

Most readers supported the ambitious target of $2,800 for that exact pattern. So let's check on the chart below and see how it plays out these days.

Monthly Gold Futures Chart

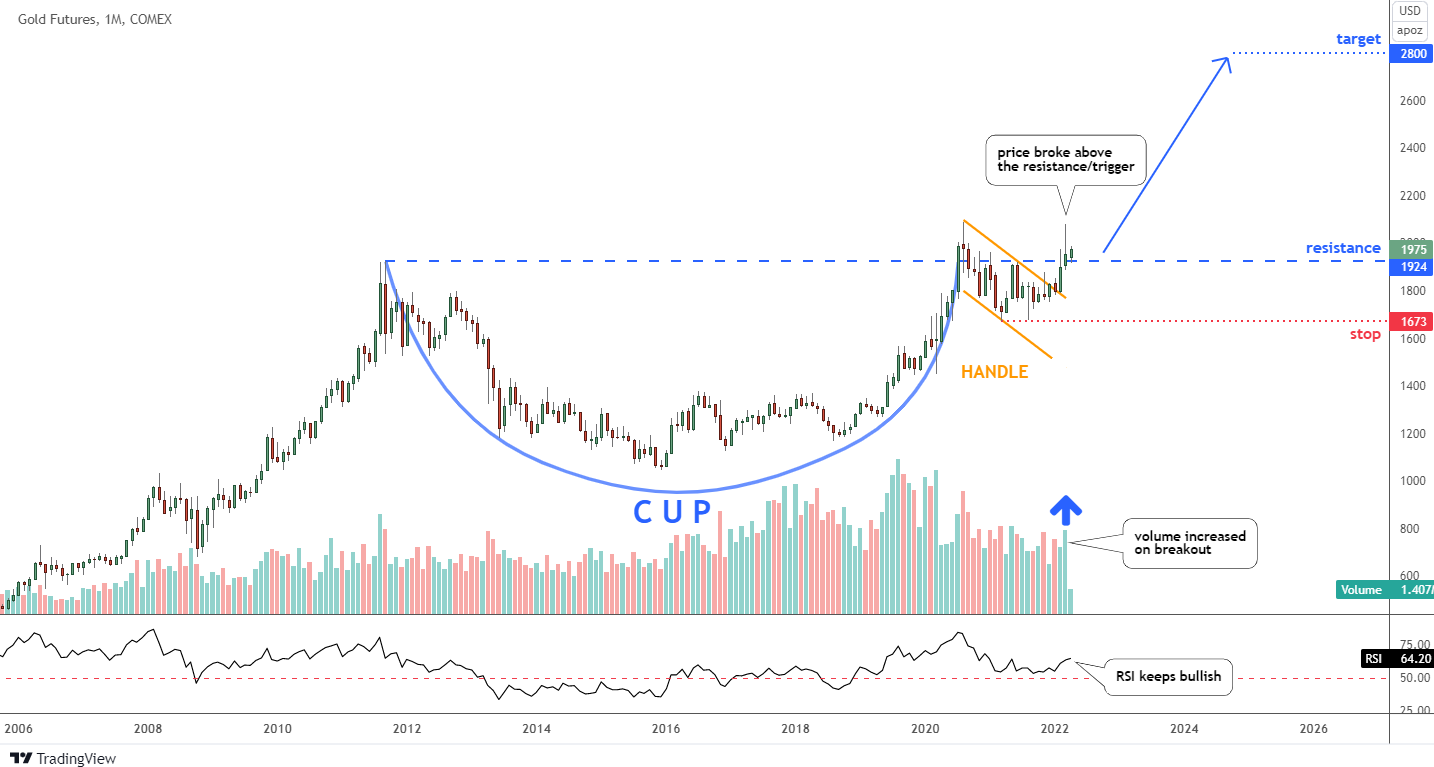
Indeed, the bullish impulse gathered enough power to break above the resistance that acted as a trigger for this pattern. The volume increased significantly, as it was required to overcome the barrier and confirm the breakout. The RSI has supported that rally as it turned north, either. Continue reading "Gold Has Repeated Bullish Pattern"

U.S. Dollar To Hit $121; Crude Oil To Hit $176?

It turned out that the dollar weakness we observed in February was about to be over right after the earlier update. I thought we would see more downside for the DX in the area between 94.4 and 92.5 (Fibonacci retracement levels) before the rally resumes, and most readers supported that idea. However, the rally started immediately.

The inflationary pressure underpins the dollar, as the Fed has turned strongly hawkish on the interest rate and tapering. Let us check out the updated daily chart below.

Dollar

In my previous post, we saw the DX piercing down the dotted gray uptrend. Those punctures turned out to be false breaks, as fallouts of the channel were temporary, and the move up resumed overcoming above the preset confirmation level of 97.4. Continue reading "U.S. Dollar To Hit $121; Crude Oil To Hit $176?"

Crypto: Failed Rally Builds Ambiguous Pattern

Before starting the crypto update, I would like to check an assumption circulating in the media regarding a strong correlation of Bitcoin with the Nasdaq 100 index in the chart below.

Crypto

It is safe to say that over the past two years, most of the time, Bitcoin was in a positive correlation with the Nasdaq 100 index. However, the current positive relationship is cooling down as we saw an almost absolute correlation at the beginning of February at 0.91, and these days it slipped down to 0.34.

Miscorrelation periods usually appear due to the higher volatility of Bitcoin and longer periods of price inertia in the stock index. In other words, these two instruments have different speeds. Continue reading "Crypto: Failed Rally Builds Ambiguous Pattern"

Silver Update: $40 Then $81?

The title of this post is not clickbait; please keep reading until the end to see why silver can hit these levels.

The bullish pattern is shown in the dollar index chart in my December post with a question in the title "Is The Dollar Going To Steal The Santa Claus Rally?" played out as planned to destroy the rally of top metals.

Let us see the updated silver chart below.

Silver Chart

The previous bullish setup for silver has been annihilated by the ongoing strength of the dollar. The price has dropped in another leg down to retest the former valley of $21.43. It has failed to update the minimum price as it stopped right there, and then the price bounced to the upside. Continue reading "Silver Update: $40 Then $81?"

Major Cryptos Enter Bullish Mode

Bitcoin

The price of Bitcoin has built two large legs down that perfectly fit the slightly up-sloping trend channel (orange). It means these legs are equal in size. It is a good sign as we could consider the large consolidation as completed then.

Since January 24, 2022, the sharp move up advanced rapidly to hit the new high of $46k last month, breaking above the earlier minor top established on January 13, 2022, at $44.5k. However, despite such good progress, that move could be just a “dead cat bounce.” Later last month, the strong collapse almost proved that. However, it turned out to be a deep retracement as there was no new low. Continue reading "Major Cryptos Enter Bullish Mode"