Gold Update: Handle Is Broken, Cup is Next, Target $2,800

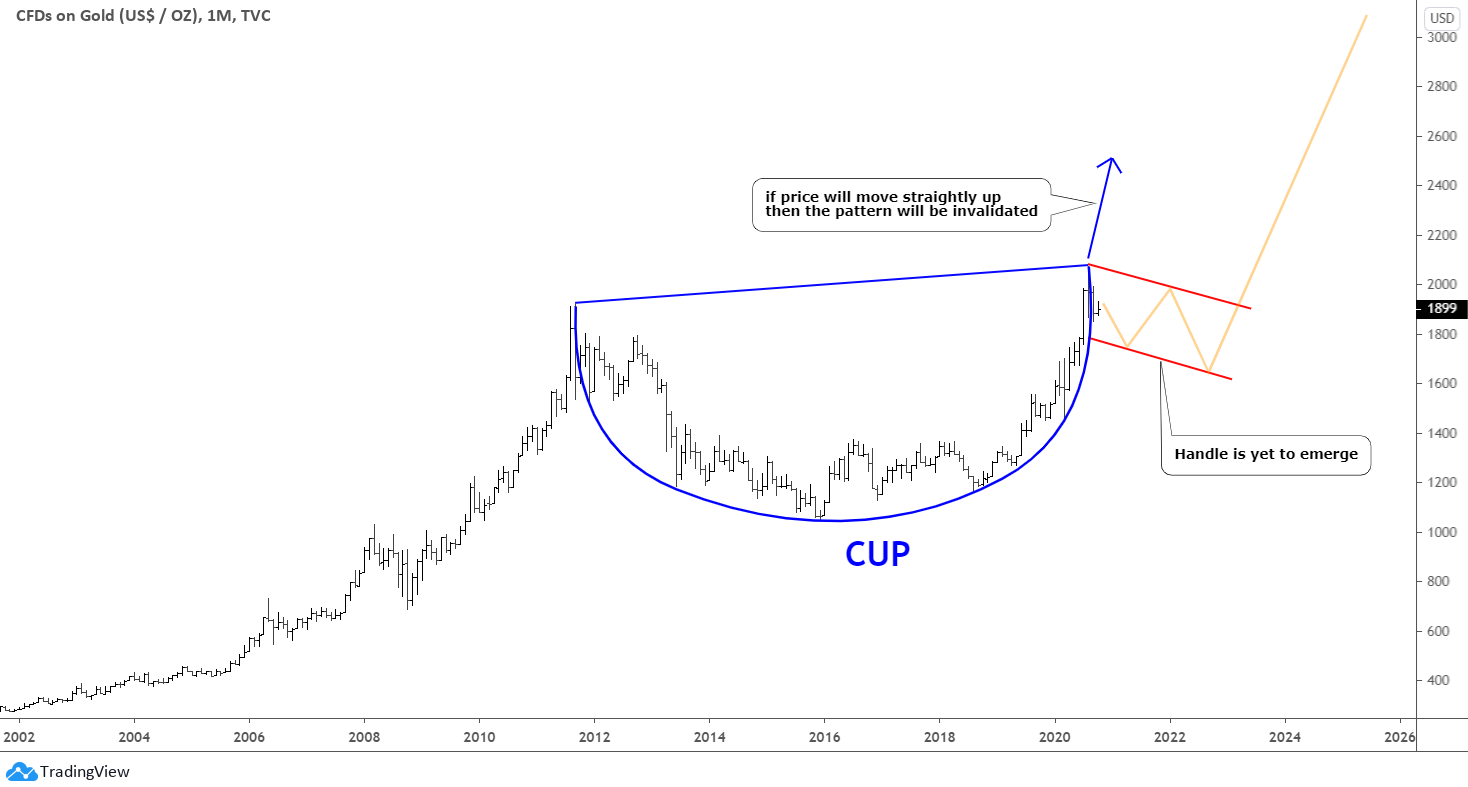
Back in October 2020, one of our readers suggested that the famous Cup & Handle pattern could have been built in the gold chart. I have checked his idea and visualized it in that very chart below from the past.

Gold

At that time, the main element Cup had already been shaped (blue). The final part of Handle was yet to appear. I highlighted the hypothetical trajectory with an orange zigzag in the declining red channel.

Let's see what is going on in the gold futures monthly chart below to check if that assumption came true. Continue reading "Gold Update: Handle Is Broken, Cup is Next, Target $2,800"

Dollar Fades After Hitting The Target

Last December, in the post titled "Is The Dollar Going To Steal The Santa Claus Rally?" I had shown you how a well-known “Double Bottom pattern” had been emerging in the daily chart. According to your voting, most of you have spotted that model as well.

I put the updated chart below to show you the path of the price on its way to the target.

Dollar Chart

The dollar index (DX) has tried to climb over the previous top right after the post. This promising attempt has failed (red X), turning into the deeper complex consolidation (red down arrow). The good thing from a technical point of view was that the price has remained above the Neckline, although the depth of correction was scary. Continue reading "Dollar Fades After Hitting The Target"

Bitcoin: Digital Gold, Inflation Hedge Or Stock Market Gauge?

Bitcoin celebrated its 13th-anniversary last month. Which place in the financial universe does this "teenager" take over the time? Naturally, the judgment on this constantly changes with the growing acknowledgment of Bitcoin. It started as a revolutionary experiment, and nowadays, it is considered a financial asset with a growing acceptance from investors reflected in the market cap of over $700 billion.

Earlier, Bitcoin was called a "digital gold," which came to replace the ancient store of value. However, it better suits the lifestyle of the modern generation, as it is easier to handle and store compared to gold; moreover, it is digitally trendy.

After that, some analysts considered it as an inflation hedge as the emission of Bitcoin is limited with twenty-one million coins while fiat is not. The ninety percent of maximum supply has already been mined.

Recently, it's been acknowledged as the gauge of the stock market as they collapsed simultaneously.

Let's check on the daily chart below to determine which nickname suits Bitcoin best. Continue reading "Bitcoin: Digital Gold, Inflation Hedge Or Stock Market Gauge?"

Palladium Update: Contradiction

In October 2021, I shared with you my technical outlook for palladium futures.

The chart structure was clear; therefore, I was confident of further collapse of palladium price. The results of your ballot are in the graph below.

Palladium

Most of you voted for a bullish trend to resume. The second popular bet turned out to be the most accurate as the price has pierced the upper side of the preset bearish target area at $1,558.

The next step after two-leg consolidation was going to be a huge growth of the metal’s price. However, the industry fundamentals do not support that bold plan. Continue reading "Palladium Update: Contradiction"

Gold Has Stalled At Equilibrium

Back in April 2020, in my post, I had surmised "Gold Could Fly Over A Helicopter Throwing Money" as the fourth round of Quantitative Easing (QE4) had started a month earlier in March 2020 with an initial pledge to inject $700 billion via asset purchases to support U.S. liquidity. The price of gold was $1,681 at that time.

We all knew that the printing press should push gold prices higher. I tried to calculate the possible target area for the gold price using comparative analysis of the past period, and then I set the range of three goals: $2,000-$2,200-$2,540. Your reaction had come as follows.

Gold Poll

The ultra-bullish $2,540 target dominated the ballot. However, the second bet with a more realistic $2,000 target was the closest yet as we saw the all-time high at $2,075 in August 2020. I guess I found the reason for this outcome in the monthly chart below. Continue reading "Gold Has Stalled At Equilibrium"