
It's hard to believe that the third quarter of the trading year is coming to a close today. It has been quite a quarter, especially the last week of September when the market volatility has been picking up.
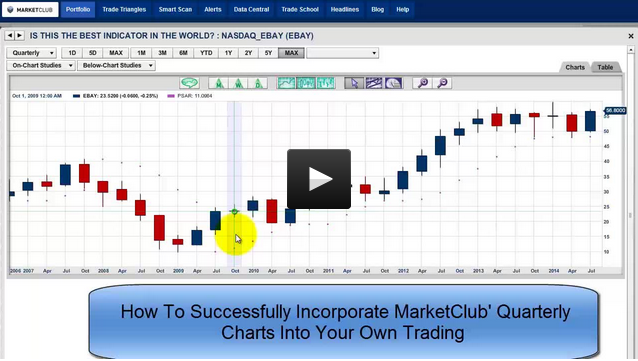
One of the tools I love looking at in MarketClub is the quarterly charts on all the markets. These charts were created to show you the big picture, as we know that investors can get sucked into short-term thinking and trading and "cannot see the forest for the trees." The biggest stand out feature for quarterly charts is their ability to clearly show the direction of the big trends. And that is really how you make the big money in trading by staying with the big trends.
Day trading can be looked upon as "very sexy," but it's not where the big money is. Arthur Cutten, a well-known trader and investor in the 20s and 30s, was asked how he made so much money trading and he answered the question this way, "By sitting." Continue reading "Is This The Best Indicator In The World?"