Jobs Report Dropped A Bombshell On The Markets

The non-farm payrolls report released last Friday dropped a bombshell on the market, revealing the US economy added 517K jobs in January 2023, surpassing expectations of 185K and the highest since July 2022.

Growth was seen in leisure and hospitality, professional and business services, health care, government, retail trade, construction, transportation and warehousing, and manufacturing. Despite tech layoffs and potential economic slowdown, the labor market remains tight, with November and December job numbers revised higher.

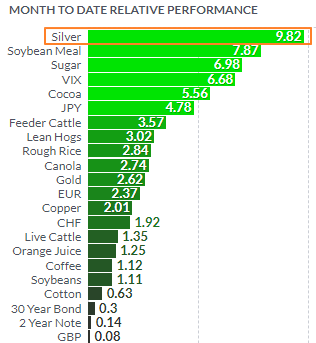
This was a real shocker that caused huge, unexpected waves of volatility in the markets. Let’s have a look at 1-day futures performance last Friday in the diagram below. It looks like a red sea with a small island covered in green grass.

1 Day Futures Performance

Chart courtesy: finviz.com

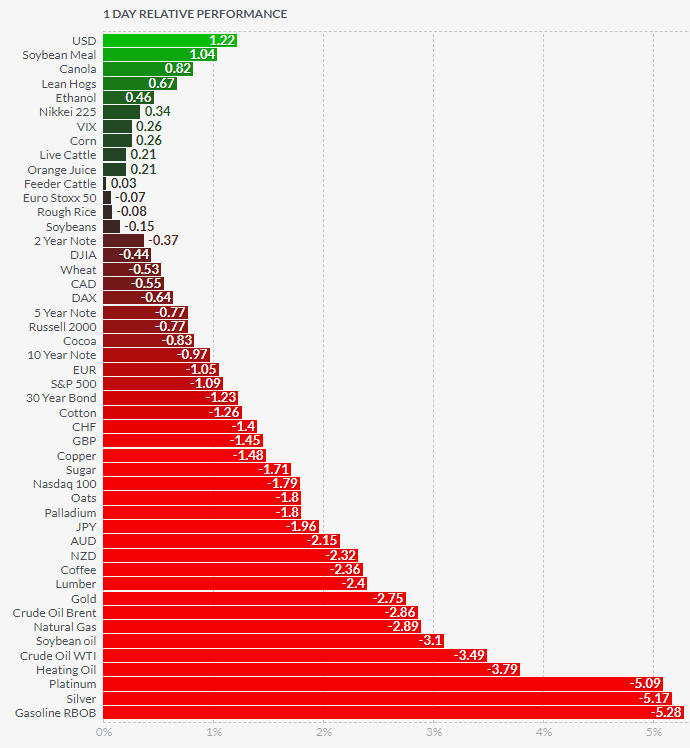
Gasoline, silver and platinum were the ultimate losers that day with massive losses of -5.3%, -5.2% and -5.1% respectively. Gold futures lost huge -2.8% as well. Palladium futures price plummeted -1.8%. Among metals, Copper futures were the most resilient at -1.5%. Continue reading "Jobs Report Dropped A Bombshell On The Markets"

Gap Offers Opportunity

The global stock market's market distortion was revealed last week. Let me share it with you in visual form below.

I put together three ETFs: Vanguard S&P 500 ETF (NYSEARCA:VOO) in the blue line representing the S&P 500 broad U.S. stock index; Vanguard Total World Stock ETF (NYSEARCA:VT) in the black line representing the global stock market and Vanguard FTSE All-World ex-US ETF (NYSEARCA:VEU) in the red line representing the stock market outside of the United States.

Vanguard VOO VT VEU Monthly

Source: TradingView

The first chart above depicts the price dynamics since September 2010. Over this long period, the US stock market has outperformed both the global market and the rest of the world.

VOO received +257%, VT received +107%, and VEU received only +21%. Indeed, the gap is huge.

Smart money waits for a market crash before adding or purchasing stocks. In this regard, I've created a new chart below to show how these three instruments have performed from the deep valley in 2020 to the top of 2021. Continue reading "Gap Offers Opportunity"

Is 'Crypto Spring' Coming?

Last week, crypto enthusiasts got a boost when the crypto market cap almost reached the mark of $1 trillion, the highest level since last November.

That very month, I shared with you the bullish signal in the Bitcoin chart I spotted then. It was a Bullish Divergence on the weekly chart of the main coin.

Below is the distribution of your opinions on that bullish alert.

Poll Results

The "I am Bearish" option had gathered the most votes. The second largest bet was to see Bitcoin bounce back towards its prior consolidation area at $30-$35k. The price of digital gold was $16.5k at that time.

Before we check what happened to the price of Bitcoin since then, let us review the major crypto market.  
Top 5 Cryptos

Source: coinmarketcap.com

These are the five largest cryptocurrencies in the table above. Top coins are monumental at #1 Bitcoin with gain of 26% year-to-date (YTD) and #2 Ethereum with profit of 30% YTD. Binance’s native coin BNB has attained #3 spot (+28% YTD) long ago, surpassing the Ripple, which is now only #4 with gain of 20% YTD. Cardano closes the ranking at #5 with the largest gain of 47% YTD. Continue reading "Is 'Crypto Spring' Coming?"

Is Dollar's Dominance Over?

Last September, the Congressional Research Service published an "In Focus" report. They had already attempted to address speculation about the dollar's dominance in the face of global economic and geopolitical changes at the time.

Three major threats were addressed in that document.

China and its currency have risen to sixth place, accounting for 1.66% of global payments.

The next source of concern was US financial sanctions, as the share of Russian exports to Brazil, China, India, and South Africa in US dollars fell from 85% in Q2 2018 to 36% in Q4 2021.

Digital currencies, which include cryptocurrencies and digital currencies issued by central banks, have completed the list.

“Some policymakers have expressed concerns about an international race to create a digital currency with widespread adoption, arguing that the United States should create a U.S. digital currency to maintain the dollar’s prominence in international payments.”

"To date, there is no evidence of a shift away from the US dollar as the dominant reserve currency," the study concluded.

Back in October, I shared my most recent update for the dollar index, as it hit the first target with a fresh outlook.

At the time, I proposed two paths for the dollar: a continuation to the next target of $121 on an aggressively hawkish Fed, or a consolidation before resuming to the upside. The majority of readers supported both paths, with the consolidation option coming out on top.

The question of the dollar's dominance is resurfacing these days, as its value has plummeted dramatically. It is too early to tell whether this is a consolidation or a global reversal.

One thing is certain: the path of unending growth has been abandoned.

In my charts, I see a clash of perspectives. The technical chart is about to give a strong bearish signal. The chart comparing fundamental factors, on the other hand, supports the king currency's continued strength.

Let me show you each of them one by one, beginning with the emerging bearish alert. Continue reading "Is Dollar's Dominance Over?"

Golden Pattern For Silver, Not Gold

Silver futures continue to maintain leadership not only among metals, but compared to all futures as we can see in the leaderboard below.

MTD Relative Performance

Chart courtesy of finviz.com

The white metal has seen gains of close to ten percent month-to-date. None of the metals come close as copper futures, formerly the number two, has lost its shine lately as I shared the reason last week. When compared to silver futures, gold futures appear pale with gains of 2.62%.   

All last week, I observed a pattern in the making, watching to see when it would trigger. As a result, exactly at the end of last week, the expected event happened. Here is a visual representation in the daily chart below.

Silver Futures Daily Golden Cross

Source: TradingView

There are two simple moving averages in the silver daily chart above. The blue line represents a 50-day moving average and the red one is a 200-day moving average. We can see that last week the short-term blue line crossed above the long-term red line. This pattern is called a “Golden Cross”. It is a bullish sign as it indicates a change in the trend to the upside. Continue reading "Golden Pattern For Silver, Not Gold"