I’ve had a bearish outlook for copper for the past 2 years, starting with my post back in September 2017 when I had doubted the metal’s ability to sustain a long-term rally. Last July, we got the final confirmation of the trend reversal to the downside. And this past February I shared with you a promising trading opportunity, which had appeared in the copper market as the short-term upward correction invited the bears to sell the copper again around $3.
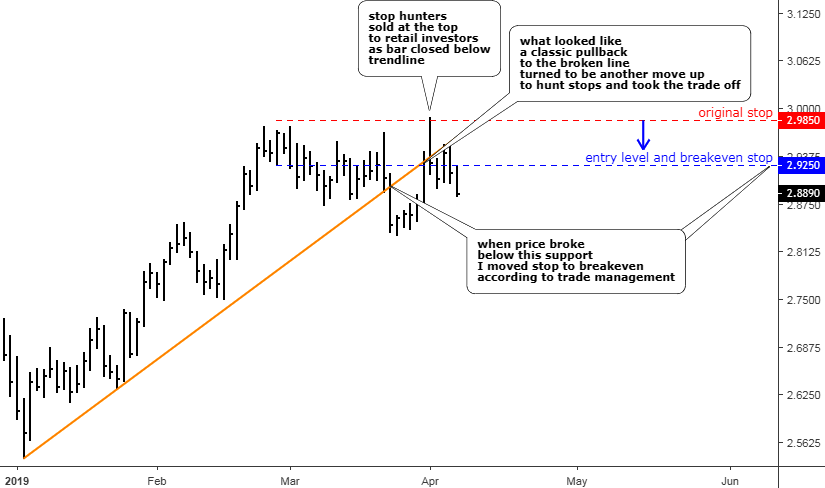
Indeed, copper has plummeted since then reaching the $2.48 low at the start of this month, but the following rapid bounce into the $2.70 area signaled a possible reversal ahead.
Let’s check the charts below to see if we can find some clues behind this worrisome price action.
I start with the weekly chart as I spotted a bullish pattern there already.
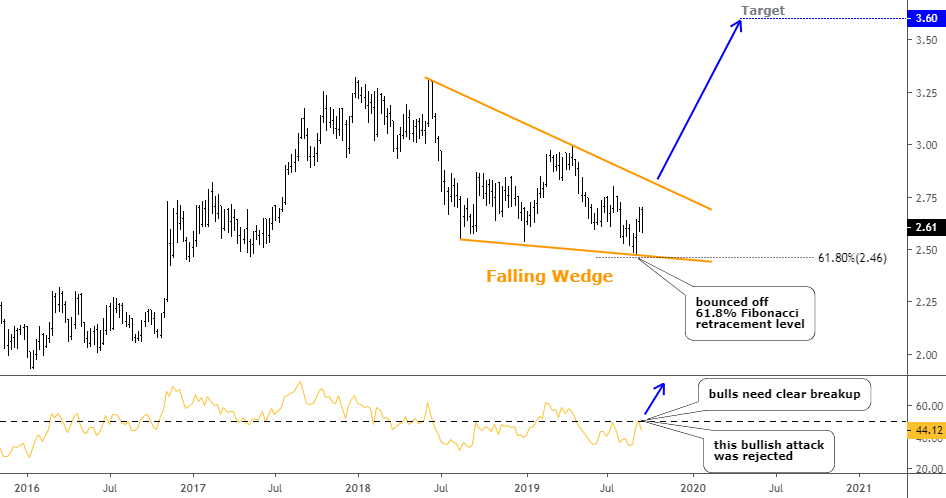
Chart courtesy of tradingview.com
As I said above the price printed the low of $2.48 and quickly reversed then. I added the Fibonacci retracement level of 61.8% to the chart, and you can see now that the price bounced right off it. In my February post, I applied AB/CD segments to set the target area for an anticipated drop and even used the extension ratio, where the CD is even larger than the AB segment. Continue reading "Copper Update: Compressed Spring Could Snap Back Hard" →