The Stock Market with Elliott Wave Labels from 1693 to Present Day Reveals a Bear Market Formation Since 2000

By: Elliott Wave International

The following article was adapted from Robert Prechter's June 2014 issue of The Elliott Wave Theorist, one of the longest-running investment letters in the business, continuously published monthly since 1979.

Figure 1 shows the stock market's waves from 1693 to the present. The circled Roman numerals denote waves of Grand Supercycle degree, the largest complete waves for which stock market data exist.

Wave I (circled) ended in 1720 at the peak of the South Sea Bubble in England. Wave II (circled) took the form of a zigzag, labeled (a)-(b)-(c); it ended in 1784. Third waves are usually extended, meaning they are longer than wave one and have clear subdivisions. This is exactly how wave III (circled) developed. It ended in 2000.

Wave III (circled) subdivides into five waves. Wave (I) ended in 1835, wave (II) in 1859, wave (III) in 1929, wave (IV) in 1932 and wave (V) in 2000.

Wave (V) subdivides into five waves, as illustrated in Figure 2. Wave I ended in 1937, wave II in 1942, wave III in 1966, wave IV in 1974 or 1982, and wave V in 2000. Continue reading "The Stock Market with Elliott Wave Labels from 1693 to Present Day Reveals a Bear Market Formation Since 2000"

Is Tesla Ready To Skyrocket?

I am sure, like a lot of traders, you are paying close attention to what is going on in Iraq, Syria and Iran. My take on the situation is that it's not going to get better and the US is certainly not going to get involved in any meaningful way. This spells out doom for Baghdad, along with a bloody civil war which may have already started.

Against that backdrop, energy prices will continue to move higher and the possibility exists that the oil fields and processing plants in Iraq could be blown up just to put that country back in the Stone Age. We are dealing with a bloody sectarian war that is and will continue to tear that country apart. It also brings to mind what is going to happen to the rest of the Middle East? This whole Middle East problem has been going on for longer than anyone cares to remember and it's only going to be settled with a "bigger stick." At the moment, ISIS has the "bigger stick," the money, and the ferocious obsession of bringing their way of life to the area and surrounding areas. All in all it does not sound like too rosy a picture to me.

That got me thinking about who or what is going to benefit from much higher energy prices. One company stands out in my mind is Tesla Motors Inc. (NASDAQ:TSLA) You're probably familiar with their expensive sports car that sells for upwards of $100,000, but they're working hard on producing a lower-priced model, one for the masses. They are also planning the largest battery manufacturing plant in the world.

All of this is driven by one man, Elon Musk, who is the driving force and mastermind behind Tesla's domination of the electric market and SpaceX. Continue reading "Is Tesla Ready To Skyrocket?"

Is Natural Gas Going To Be The Stealth Bull Market Of 2014?

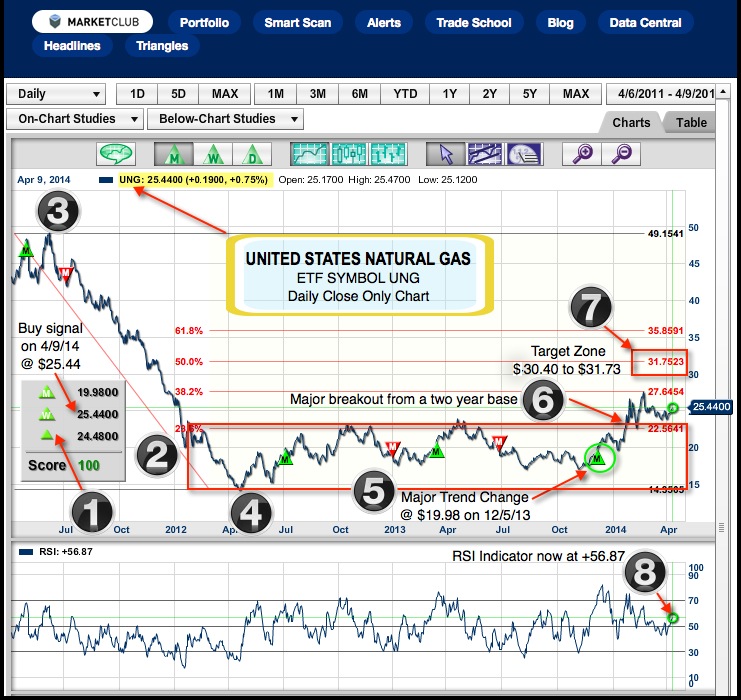
Yesterday the United States Natural Gas ETF, trading under the symbol PACF:UNG, triggered a new weekly green continuation Trade Triangle at $25.44.

What is interesting about this market is the fact that it has broken above a two-year base, which I believe is very significant longer-term. With the recent pullback from the highs of $27.64, we actually stopped at the previous highs that were set in October 2012 and again in May 2013. Technically, this market looks very good and I am going to layout my case with simple numbers you can tie into the chart.

Looking at a chart of UNG, the most dominant features I see is the two-year base, (number 2) and a breakout over the two-year base (number 6). Continue reading "Is Natural Gas Going To Be The Stealth Bull Market Of 2014?"

What now for the S&P500?

The dramatic run up that we have seen in the S&P 500 may be coming to an end. The retracement back over the 840 level should provide sufficient resistance to reverse this market to the downside.

Now here is the caveat, our long-term indicator, the monthly "Trade Triangle" remains negative on this market. While the direction of our weekly timing "Trade Triangle" is on the sidelines and neutral. This has created a conflict, meaning that conservative traders should remain on the sidelines to protect capital.

I am looking for an area to once again get short this market and trade with the major trend in our favor.

My downside target zone is for an eventual move down to the 500 level. Only if we take out highs as I mention in the video, then this analysis will change. Continue reading "What now for the S&P500?"