Three Gold Miners To Buy On Dips

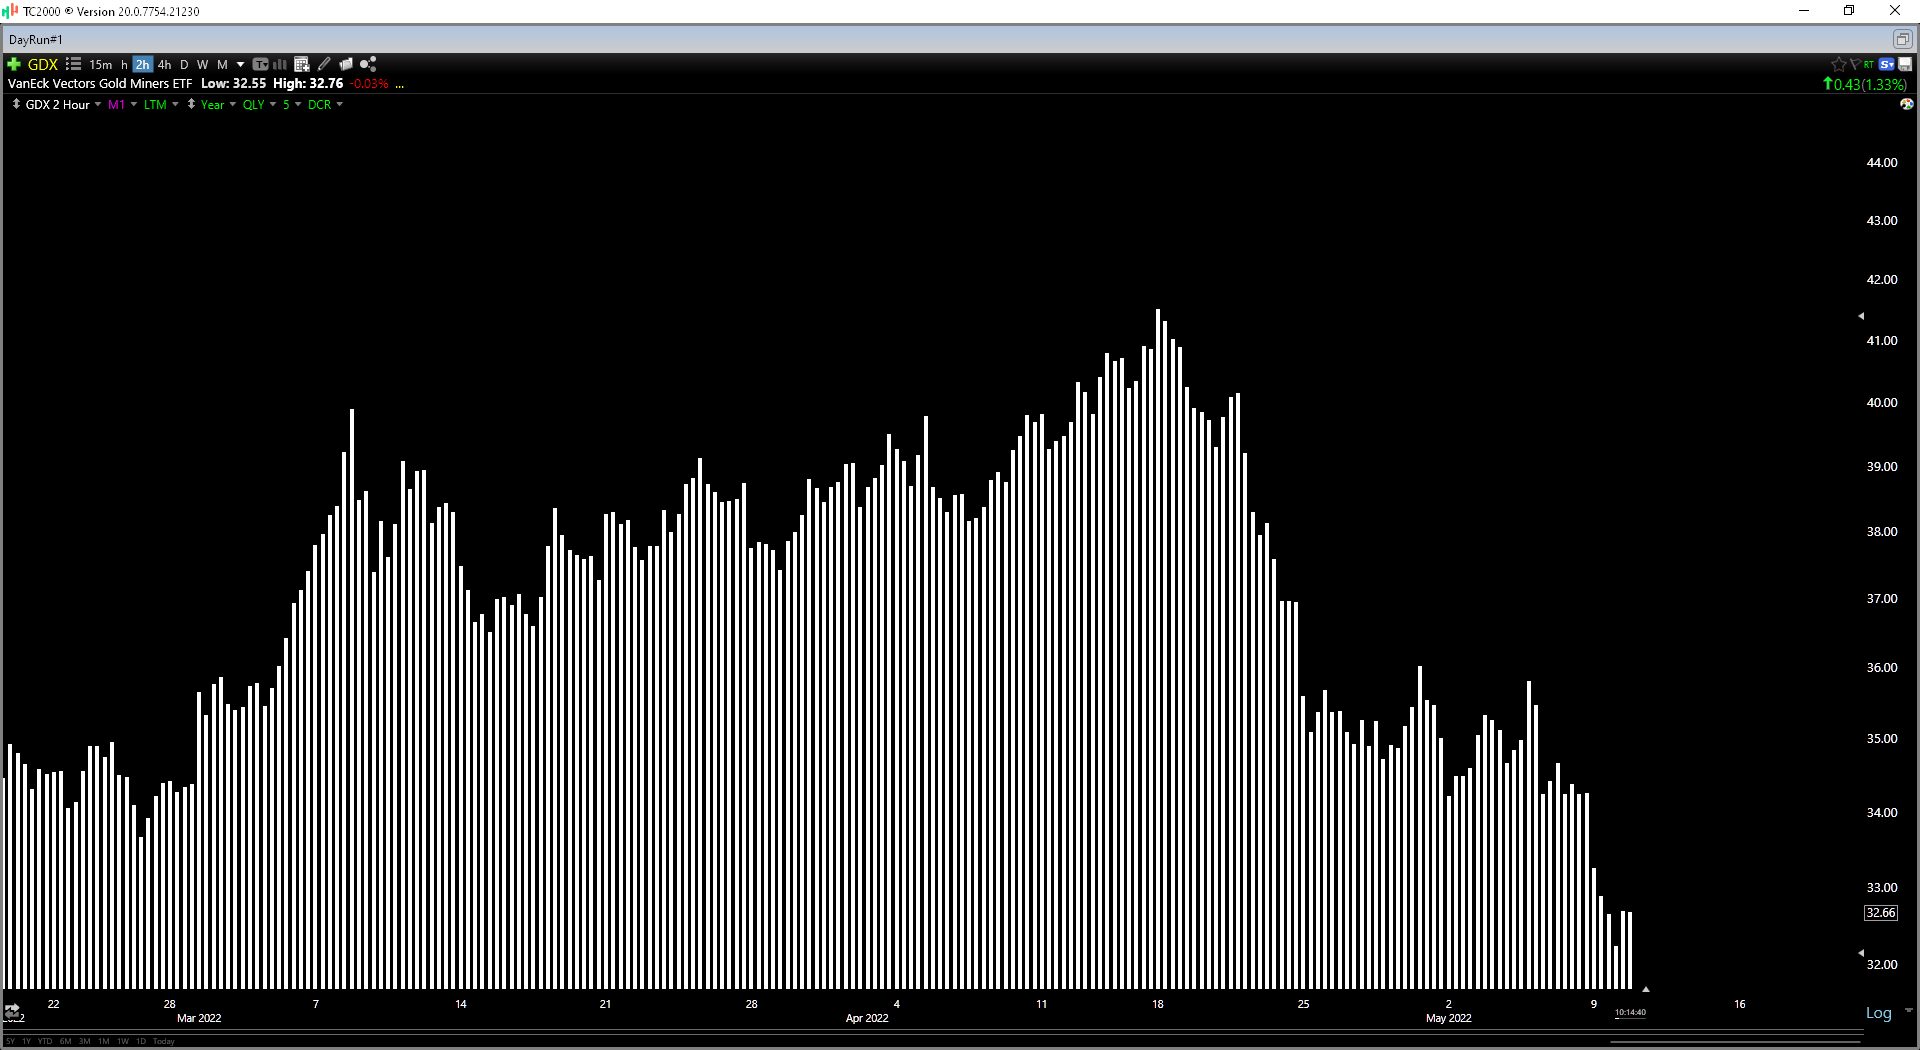
It’s been an ugly week for the major market averages, with the S&P 500 (SPY) continuing its violent decline from its Q1 highs. Prior to this week, the Gold Miners Index (GDX) was a sanctuary from the turbulence, but when the market heads past the 15% correction mark, few stocks are sheltered from the turbulence. While this has been painful for investors that chased miners in early Q2 near their highs, this is set up an excellent buying opportunity for patient investors. So let’s look at a few names in the GDX where the selling looks to be overdone:

GDX Gold Index

Source: TC2000.com

Over the past month, we’ve seen several gold miners slide more than 25% from their highs, and in many cases, these corrections are entirely justified. This is because several producers have weak balance sheets and high costs, making them very sensitive to weakness in the metal price and rising interest rates. However, when it comes to names like SSR Mining (SSRM), Yamana Gold (AUY), and Barrick (GOLD), which are sitting in net cash positions or expect to be net-cash positive by Q4, the recent pullback makes little sense, especially given that they’re some of the best operators sector-wide. Continue reading "Three Gold Miners To Buy On Dips"

Gold Has Repeated Bullish Pattern

Back in February, I shared with you an updated monthly chart of gold futures with a completed Cup & Handle pattern just ahead of a potential breakout above the preset trigger.

Most readers supported the ambitious target of $2,800 for that exact pattern. So let's check on the chart below and see how it plays out these days.

Monthly Gold Futures Chart

Indeed, the bullish impulse gathered enough power to break above the resistance that acted as a trigger for this pattern. The volume increased significantly, as it was required to overcome the barrier and confirm the breakout. The RSI has supported that rally as it turned north, either. Continue reading "Gold Has Repeated Bullish Pattern"

Gold Update: Handle Is Broken, Cup is Next, Target $2,800

Back in October 2020, one of our readers suggested that the famous Cup & Handle pattern could have been built in the gold chart. I have checked his idea and visualized it in that very chart below from the past.

Gold

At that time, the main element Cup had already been shaped (blue). The final part of Handle was yet to appear. I highlighted the hypothetical trajectory with an orange zigzag in the declining red channel.

Let's see what is going on in the gold futures monthly chart below to check if that assumption came true. Continue reading "Gold Update: Handle Is Broken, Cup is Next, Target $2,800"

Copper/Gold Ratio At Epic Decision Point

Copper/Gold ratio teases cyclical inflation bulls and bears alike, but… it’s going to break one way or the other soon enough.

If you value gold’s standing in relation to industrial metals as a key market/financial/economic indicator as I do, then you view the ongoing consolidation in the copper price to the gold price as a key indicator (among several NFTRH tools) going forward.

I cannot make the macro do what I want it to do, but I sure can be super interested in an indicator that has made several false moves to the positive and negative sides in 2021 as we head into a year of changes to come (one way or another) in 2022. Cu/Au is making less and less volatile spikes and drops as it is currently pinched between the converging daily SMA 50 and 200.

They call him Doctor Copper because in the post-2000 world of Inflation onDemand © 🙂 (as originally concocted by the Maestro himself, Alan Greenspan and expanded ever so maniacally by Ben Bernanke on through the current Fed regime), the cyclical economic doctor metal is a key foil to the counter-cyclical monetary historian metal. Continue reading "Copper/Gold Ratio At Epic Decision Point"

Gold, Silver, Gold/Silver Ratio & HUI

Precious metals are still locked down. With an understanding that there is always much more in play than nominal charts (the macro & sector fundamentals for example, which bounced of late but never did definitively flip positive), let’s review said nominal charts of gold, silver, and HUI along with an update of the Gold/Silver ratio for good measure.

Meanwhile, we will continue to update the full spectrum of considerations for a positive view of the precious metals complex, including gold’s standing vs. cyclical, risk-on markets/assets, the state of speculative vs. quality credit spreads, the inflationary backdrop (despite promotions to the contrary, cyclical inflation is not beneficial to the gold mining industry), the seasonal averages and the charts of the metals and miners over various time frames in NFTRH.

Gold

The daily chart shows the gold price (futures) below the moving averages but above short-term support after failing – amid much personally observed cheerleading to the contrary – to cross the bull gateway at 1920.

As a side note, the broken blue downtrend channel on this daily chart is actually the Handle to a large and bullish big picture Cup that only has one thing going against it that I can see; too much exposure by too many TAs, which of course means it may not be expressed until many of those TAs recant their stories (we have noted all along that the Handle can drop all the way to the 1500s without damaging the 2022 bullish Cup story. Indeed, if it were to happen (not predicting folks, but being prepared) it would be healthy. There is nothing healthier than a good running of the bugs before a major bull move. Continue reading "Gold, Silver, Gold/Silver Ratio & HUI"