My Secret Formula For Successful Gold Trading

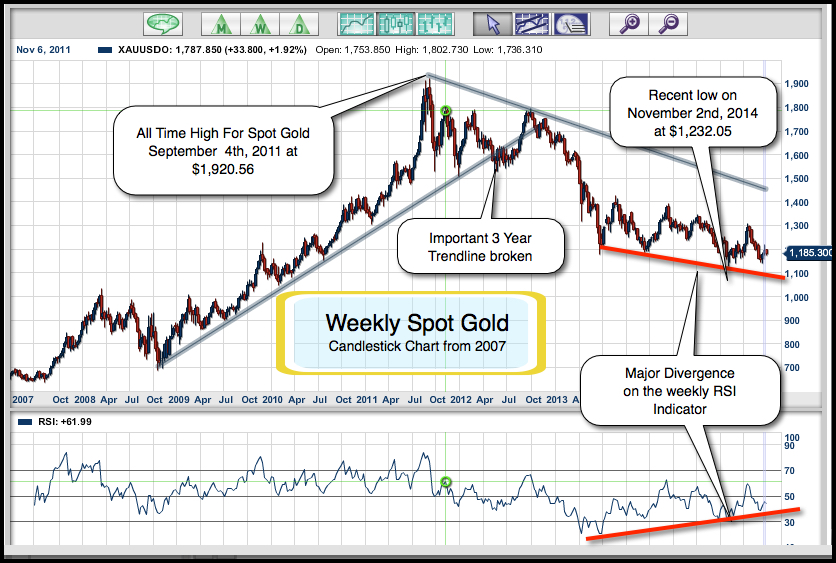
The price of gold is now in its fourth year of a bear market. It is shocking to many gold bugs that gold, a metal revered since ancient times, could fall so dramatically from its all-time high of $1,920.56 on September 4th, of 2011. The precipitous drop of almost $800 in less than four years was more than most gold bugs could stand as stocks soared to new highs. Many threw in the towel when gold hit $1132.05 on November 7th and moved into stocks. This could prove to be a bad omen in the future. Since reaching a low on November 7th, gold has for the most part moved sideways with a slight upward bias.

You can clearly see on the chart that there is a big divergence that shows. When prices were making their lows, momentum was building for the market to bounce.

Now for the good news! Continue reading "My Secret Formula For Successful Gold Trading"

Gold Is Sending A Very Strong Message, Are You Listening?

Hello MarketClub members and friends of MarketClub everywhere! Today, I have a brief market update on the general market and an in-depth analysis on gold.

2015 has not started off too well for the US equity markets, while the reverse seems to be true for the action in gold (FOREX:XAUUSDO). What's going on? Oil continues to slip, which most economists thought would be good for the economy, but it does not seem to be helping the market. This brings me to my next thought...

Do you know about the "January Barometer"? Since World War II, if the market closes down in January, the average price change was usually flat in the remaining 11 months. So while certain stocks may do very well overall if the market closes down this month, look for a less than stellar year.

As you can see, while stocks have been swooning, gold has actually been on the move to the upside. As I write this, gold is up almost 3% and we are only 6 days into January!

Take a look at the chart and you can see that gold has almost completed an important technical formation known as a "head and shoulders bottom", one of the most reliable formations in your technical arsenal.

A higher close today clearly breaks over the the all important "neckline" resistance level. Once over the "neckline," I can see gold moving based on the head-to-neckline measurement up to the $1,330 to $1,340 level.

Wishing you all the very best in 2015.

Every success with MarketClub,
Adam Hewison
President, INO.com
Co-Creator, MarketClub

Gold Futures Rise Above $1,200 as Demand for the Metal Rises

By: FX Empire

After an early-session steep decline, Comex gold futures are now trading significantly higher. The early session sell-off was in response to trader reactions to the failure of the Swiss referendum to increase Swiss National Bank gold reserves; although the vote to not increase the reserves from 7% to 20% was anticipated, the market still dove nearly 2% as a result.

"We didn't think that vote was going to pass. Nobody thought that, but they've cleared the air," explained George Gero of RBC. He continued on to say that what brought gold back was the fact that there are three continents that have to stimulate their economies. The market was being pulled by buyers who are bargain hunters wanting to take advantage of the plunge in the price of gold, and then it was pushed back again by the dollar, as well as by deflation.

Comex gold futures for February hit $1,221 per ounce and then settled with a gain of 3.6% to $1,281. This has been the biggest swing since April of 2013. Continue reading "Gold Futures Rise Above $1,200 as Demand for the Metal Rises"

HUI, Gold & Silver; Fun With Monthly Charts

Outside of the sound practice that is physical gold ownership in a time of monetary gamesmanship, the precious metals sector is all about speculation, at least according to 9 out of 10 chart jockeys and momentum junkies micro managing every short-term twist and turn.

Indeed, NFTRH manages gold, silver and the gold stocks on down to the short-term views as well, but that is only because the long-term views have stated that this is a time to be paying attention.  Do we pay attention because we have waited so long to promote our orthodoxy and finally be right as gold bugs?  No.  We pay attention when a chart tells us to pay attention.

While we manage the shorter-term views (both macro fundamental and technical) rigorously in the weekly report and interim updates, here I’d like to dial out to the big monthly picture with 3 large (click to expand as needed) charts of HUI, Gold and Silver to see their stories, which are the reasons we are managing shorter-term views.

HUI Gold Bugs Index

hui

First HUI monthly reviews the warnings to the analysis from 2012 and 2013.  They were very clear and should have kept people out of much of harm’s way with respect to gold stock speculation. Continue reading "HUI, Gold & Silver; Fun With Monthly Charts"

1.2 Billion Passwords, Putin and Cyber-Warfare

Normally the summer months tend to slow down as most traders like to get away for a short break and a little R and R. This year however has been different, as turmoil in the world stage continues. You only have to look at what is going on in the Ukraine, which continues to escalate with Putin's quest to restore the old Soviet Empire. Over in the middle east, the picture is grim and the hatred between Hamas and Israel shows no signs of a resolution. With all that going on, you would think that nothing else could come along to upset the apple cart.

The biggest news this week in my mind was not the Ukraine or the conflict between Hamas and Israel, it was the theft of 1.2 billion usernames and passwords!

This astounding feat was accomplished by a small group of eight Russian hackers. As you may recall, the US and Europe upped their sanctions on Russia, and tit for tat, Russia turned around and cut imports from both Europe and the US. I am afraid that the theft of 1.2 billion usernames and passwords is just another escalation of cyber warfare that Russia is spearheading against the West. Continue reading "1.2 Billion Passwords, Putin and Cyber-Warfare"