This Is Not Your Grandpa's Inflation Problem

The Fed is starting to play catch-up with inflation signals from the bond market as evidenced by the Fed Funds Rate finally being pulled upward by the implications of the rising 3 month T-bill yield, among other more obvious signals like the long since rising 2yr Treasury yield and ongoing inflation headlines we read about every day.

After the June FOMC meeting, an additional .5% hike will be in the bag as CME Group traders are forecasting.

But as noted in this post about the May ISM (manufacturing) and Payrolls, supply chains are ever more involved in the narrative. Captain Obvious wants you to know that an economic drag is being caused by the past and present COVID-19 shutdowns, the war in Ukraine, and increasing global political tensions and saber rattling. Continue reading "This Is Not Your Grandpa's Inflation Problem"

Historical Bear Market Comparisons

2022 Bear Market

Although there’s not an official bear market definition, those on Wall Street define a bear market as a 20% drop in the broader index. As of late May, the Nasdaq, Russell 2000, and S&P 500 have all breached that 20% sell-off threshold. This bear market is largely due to a confluence of the China Covid lockdowns, the Russia/Ukraine war, persistent inflation, and rising rates. All these bear market inputs are eroding companies’ margins and negatively impacting profitability and growth.

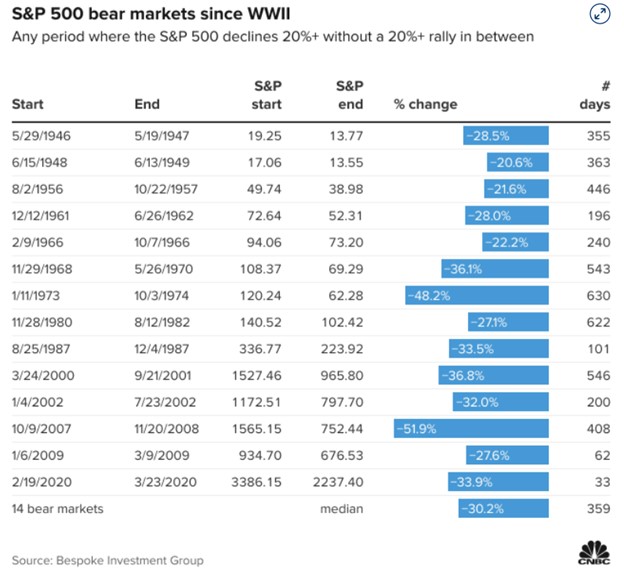
Looking at historical bear market comparators, there’s been 14 since World War II. The S&P 500 has pulled back a median of 30% and the selling has lasted a median of 359 days, per Bespoke Investment Group. It’s important to put the median in a statistical context, median translates into half the time the index has fallen more than 30% while half the time the index has remained above the 30% sell-off level. The 2022 bear market is only 136 days in as of March 20th, 2022. Although the median values suggest these markets may have a way to go, the resolution of one or a combination of the macroeconomic issues may be the needed catalyst for the bears to capitulate.

Bear Market Comparison

Markets On Edge

It's been challenging to endure the last five months of indiscriminate and relentless selling across all asset classes. The wealth destruction has been vast and safe haven stocks have been few and far between at this stage of the bear market. The bear has finally mauled Walmart (WMT), Apple (AAPL), and the flight to safety commodity, Gold (GLD) in its path of destruction. Continue reading "Historical Bear Market Comparisons"

As Inflation Signals Cool, Various Markets Get Relief

Whether a bounce or something more extended, a bear market rally was bound to get off the ground sooner or later. It was a matter of time, with stock market sentiment this over-bearish.

Here is how the US Stock Market segment led off last weekend in NFTRH 706:

bear market

We then covered the technically bearish state of the major indexes, which are clearly trending down on longer time frames. Sentiment is a tool. TA is a tool. Macro fundamentals are another tool. These tools and others should be used together to refine probabilities in the markets. Continue reading "As Inflation Signals Cool, Various Markets Get Relief"

A Market Festivus

They say that Festivus is the “anti-Christmas”, but in this case we are going to call it the anti-Christmas Eve as the markets close out 2018’s Christmas Eve massacre.

“Many Christmases ago I went to buy a doll for my son. I reached for the last one they had, but so did another man. As I rained blows upon him I realized there had to be another way!”

This year markets are going another way.

Market festivus

We have been managing a potential Christmas Eve close-out sale in the stock market since SPX hopped the Bull Turnstile, negating topping potential and confirming bullish ascending triangles (not shown below as they appeared on daily charts) and its own major trends by breaking upward. Here is the most recent chart (from NFTRH 582) used to illustrate the situation.

Please consider this weekly chart for reference only. We had a lot of words in #582 about what I think is in play, but ultimately this public post is simply illustrating what is currently in play. And that is an upside extension (with associated sentiment readings to be updated this weekend in NFTRH 583) that would be roughly equal and opposite to the 2018 downside blow off (note: though the chart allows for higher levels, SPX has already qualified for a price and sentiment close-out, in the general spirit of the season). The blue box is the same height as the yellow shaded area. It’s more art than TA, but there you have it… some frame of reference. Continue reading "A Market Festivus"

This Is Status Quo Time

Hello MarketClub members everywhere! Despite the rally on Friday, there's been little change to the overall status quo of a broad trading range that I believe the indices are in.

Indices

On Friday the DOW (INDEX:DJI) closed at its best levels in 10 weeks, bringing it back up to the Nov/Dec lows which should act as natural resistance. The Dow is still in a 61.8% Fibonacci close-only retracement mode and should begin to falter around current levels. That's not to say that it can't go a little higher, but I think that it's doubtful that it can sustain higher values.

You can see much of the same picture with the S&P 500 (CME:SP500) as it is back into an area of Fibonacci resistance. I still believe that this index is cranking out a major top which began in August 2014. This week should be an interesting one as I expect to see more two-way trading, the key of course is where it closes Friday. Continue reading "This Is Status Quo Time"