Oil Market Scenarios And Risks: 4Q18

Major uncertainties loom toward the end of the year when sanctions are currently scheduled to go into effect by the U.S. regarding Iran. The range of potential outcomes is large, as it is possible that a deal may be reached with Iran which avoids sanctions (Iranian President Hassan Rouhani in a speech Sunday did not rule out peace between the U.S. and Iran), or Iran increases its exports to China and India, offsetting decreases to European countries. But the base case should assume some loss, on the order of 600,000 b/d.

President Trump has a few policy options to manage the size of the loss:

  • Pressuring the Saudis and other Gulf producers to maximize their output
  • Granting waivers so that more exports can flow
  • Ordering drawdowns of the Strategic Petroleum Reserve, potentially coordinated with the International Energy Agency

But Iran’s production is not the only risk. Venezuela’s production is in a meltdown and production may drop to just one million barrels per day by the end of the year. Whether it could stabilize at that level is an open question and is sure to provide a risk premium to oil futures prices.

I created three scenarios to develop a range of likely global inventory levels and future oil prices. The base case “demand for OPEC crude” is from OPEC’s own July Monthly Oil Market Report. In all three scenarios, I assume production in Venezuela drops to one million barrels per day (mmbd) by 1Q19 and stabilizes there. I also assume that Saudi production rises to 11 mmbd and remains at that level and production increases in the UAE and Kuwait. Continue reading "Oil Market Scenarios And Risks: 4Q18"

Oil Price Implications Of OPEC's New Oil Deal

OPEC concluded its meeting on June 22nd with a vaguely-worded communique about its oil deal:

“Accordingly, the Conference hereby decided that countries will strive to adhere to the overall conformity level of OPEC-12, down to 100%, as of 1 July 2018 for the remaining duration of the above-mentioned resolution and for the JMMC to monitor and report back to the President of the Conference.”

At the press conference afterward, OPEC president HE Suhail Mohamed Al Mazrouei, UAE Minister of Energy and Industry, struggled to explain exactly what it meant. When asked how many barrels would be added, he remarked that “you can do the math” between current output and the 100 percent conformity level, although he later said it was about one million barrels per day.

However, at the press conference of the 4th OPEC and non-OPEC Ministerial Meeting on June 23rd, oil ministers Khalid al-Falih of Saudi Arabia and Alexander Novak of Russia, responded to questions, explaining the new deal and how it would be implemented.

But Iran’s oil minister later said that OPEC’s oil output agreement did not specify a production increase, which probably explains why the agreement was left vague. It also explains Mr. Al-Falih’s unusual remark at the press conference: Continue reading "Oil Price Implications Of OPEC's New Oil Deal"

Oil Market Risks For 2018: Upside Then Downside

Robert Boslego - INO.com Contributor - Energies - Oil Market Risks 2018


Fears of potential shortages from the implosion of Venezuela’s production, and the imposition of sanctions on Iran, have catapulted the Brent oil price marker to $80. However, there are great uncertainties about how much oil supplies will be disrupted over the balance of 2018, and what the supply response will be from OPEC and other producers, such as Russia and the United States.

Venezuela’s production fell by 45,000 b/d in April from March, averaging 1.47 million barrels per day. The April decline was equal to the average monthly drop thus far in 2018. Whether the rate of decline will increase, or stay the same, is unknown, but what is known is that oil workers have been leaving the country, unpaid.

The May 20th presidential election has been called a sham. And President Trump is considering sanctioning Venezuela's oil or prohibiting the crude to be sold in the U.S. If he does, Venezuela’s economy is expected to collapse because it is totally dependent on oil revenues. Continue reading "Oil Market Risks For 2018: Upside Then Downside"

Updated World Oil Forecast For April

Robert Boslego - INO.com Contributor - Energies - World Oil Forecast


According to the Energy Information Administration (EIA), world oil production will exceed demand for much of the balance of 2018, and therefore global OECD oil inventories are projected to rise. Specifically, the EIA estimates that OECD inventories bottomed at the end of March at 2.784 million barrels (mmb) and will rise by 80 mmb through year-end, up 26 mmb from December 2017. And its projections through 2019 show another net stock gain of 34 mmb to end the year at 2.898 mmb.

World Oil Forecast

The DOE forecasts for 2018 and 2019 are based on dramatically different seasonal stock changes that occurred in 2017. OECD stocks fell by over 147 mmb from August through December, according to the latest estimates. But in 2018, it is predicting a net stock build over those same months.

World Oil Forecast

In 2019, it is forecasting a build similar to 2018, but without a first-quarter draw. Continue reading "Updated World Oil Forecast For April"

What Inventory Level Should OPEC Target?

Robert Boslego - INO.com Contributor - Energies - OPEC


On November 30, 2016, OPEC’s press release announcing the supply target of 32.5 million barrels per day included the following reference to inventories:

“The numbers underscore that the market rebalancing is underway, but the Conference stressed that OECD and non-OECD inventories still stand well above the five-year average. The Conference said it was vital that stock levels were drawn down to normal levels.”

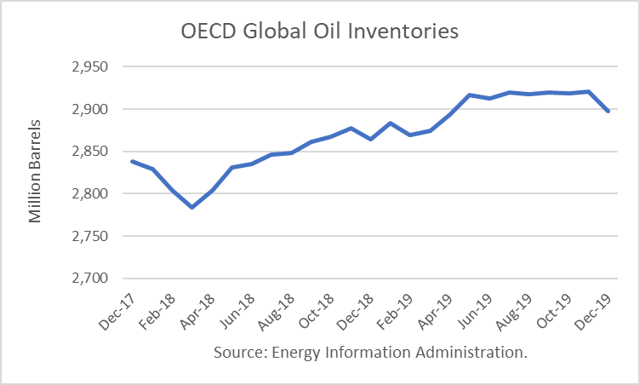
Since the middle of 2017, OPEC has compared the OECD inventories to the five-year average, which had been 2010 to 2015. At some point in 2017, OPEC adjusted the five-year average to include 2011 to 2016. In doing so, it included two-and-a-half years of glutted (not normal) inventory levels. The effect was to make current levels appear to be closer to “normal” levels.

Given that OECD inventories are approaching the elevated five-year average, Saudi Energy Minister Khalid al-Falih has recently questioned that yardstick.

"Do we need to adjust for rising demand and look at forward day cover? How do we deal with non-OECD inventory? (It's) less transparent and reliable,” Falih said. “We have to think of the global market, the center of demand has shifted from OECD to non-OECD.”

Analytical Findings

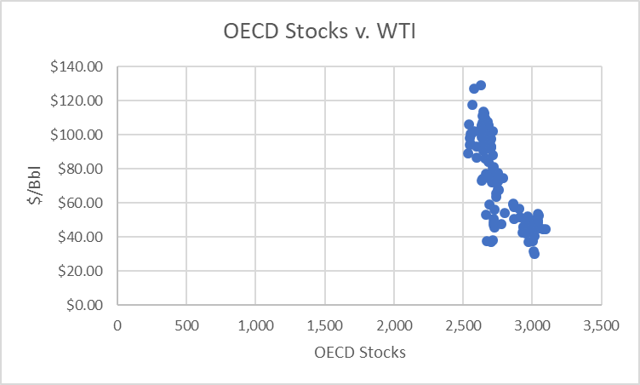
Using historical supply-demand data and prices, I found a correlation between stocks and prices over time, but it is far from precise. That makes sense because price behavior is much more complex than using one measurement to define it. Market sentiment and positioning tend to cause prices to overshoot and undershoot equilibrium prices. To paraphrase the Noble Prize-winning economist Robert Shiller, prices are more volatile than the fundamentals imply.

Using monthly data from January 2008 through December 2017 (a full 10-year period), I found a -79% correlation. The Cartesian coordinate graph is depicted below:

OPEC

I developed a simple linear regression to fit prices, given the inventory level, and graphed the actual prices with fitted prices:

OPEC

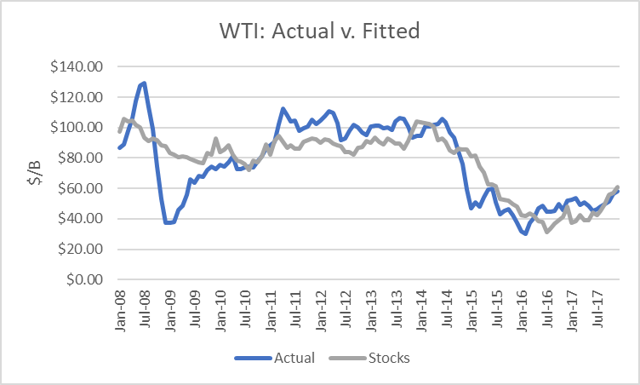
This illustrates how far prices can travel from an equilibrium price, especially in 2008-09. On the other hand, the fitted prices do match up with actual prices over time. And the December 2017 fitted price ($61) is quite close to the actual price ($58).

This historical analysis begs the question, where are prices likely to go in 2018 and 2019? It also serves as a guide for understanding what stock level OPEC+ needs to achieve by withholding supplies.

Conclusions

To answer the first question, I used EIA’s STEO forecast of OECD stocks for 2018 and 2019. The forecast shows stocks bottoming in February, which would correspond to a topping of prices at $63.76, using this methodology. It implies that the $66.66 reached in January is likely to be the peak for 2018 and 2019, with prices dropping back into the lower $40s next year.

OPEC

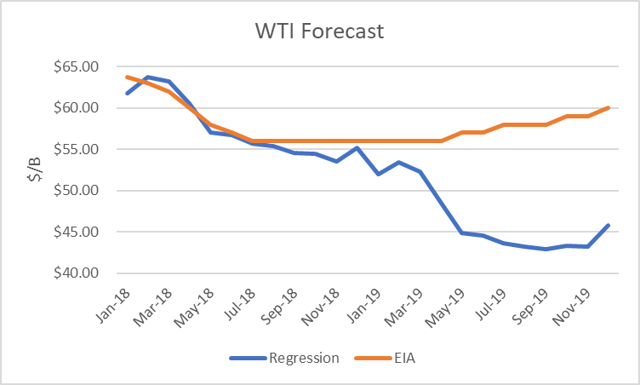
I also included EIA’s own price forecast on the graph for comparison. It shows similar expectations for the first half of 2018, but that prices will hold above $55 for the forecast period.

Regarding OPEC’s target, the regression shows that if inventories remain right about where they were at end-December (2.870 billion), the WTI price would remain at $60/b. If it wants $70/b, it needs to get OECD stocks to drop to about 2.800 billion. By the way, the latest 5-year monthly moving average is at 2.830 billion.

This model is very simplistic and does not include the impact of trader positioning and sentiment, which I believe are highly influential to the price. For example, the large drop in prices during the first week of February illustrated that factor. I use my Vertical Risk Management model to assess sentiment for positioning.

The other qualification is that the marginal cost of production and the timing of supply response have changed greatly due to the shale oil revolution. The large inventory of DUCs and much faster response of short-cycle oil has changed the market. For those reasons, lower inventories are required to support the same price. On the other hand, there is much more demand at the same price than compared to five to ten years ago. On balance, those two factors may be doing a good job canceling each other out since my regression using forward cover, instead of stocks, produced a lower correlation.

Check back to see my next post!

Best,
Robert Boslego
INO.com Contributor - Energies

Disclosure: This contributor does not own any stocks mentioned in this article. This article is the opinion of the contributor themselves. The above is a matter of opinion provided for general information purposes only and is not intended as investment advice. This contributor is not receiving compensation (other than from INO.com) for their opinion.