MarketClub is known for our "Trade Triangle" technology. However, if you have used other technical analysis indicators previously, you can use a combination of the studies and other techniques in conjunction with the "Trade Triangles" to further confirm trends.
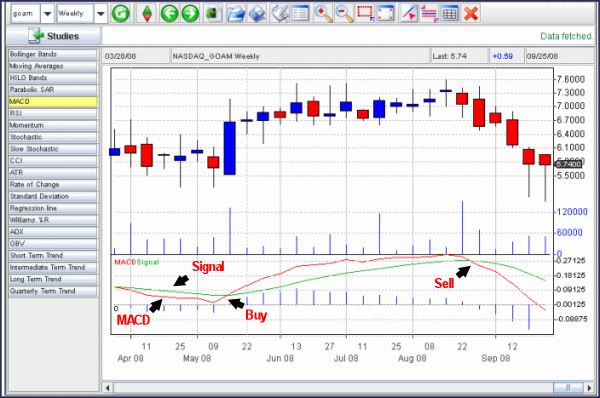
Developed by Gerald Appel, this indicator consists of two lines: a solid line called the MACD line and a solid line called the signal line. The MACD line consists of two exponential moving averages, while the signal line is composed of the MACD line smoothed by another exponential moving average.
To complete the standard calculation of the two lines, you must:
- Calculate a 12-period exponential moving average of closing prices
- Calculate a 26-period exponential moving average of closing prices
- Plot the difference between the two calculations above as a solid line. This is your MACD line.
- Calculate a nine-period exponential moving average of the MACD line and plot these results as a dashed line. This is your signal line.
MarketClub will do the above calculations for you. The MACD line is represented by a red solid line and the Signal line is represented by a green solid line. The default values for this study are set to the suggest values listed above.
The most useful signals generated from this system occur when the solid red (MACD) line crosses below the green solid line (Signal) and a sell signal occurs when it crosses above the signal line.

---
 You can learn more about the MACD and Gerald Appel by visiting INO TV.
 As you learned in the first Whiteboard lesson, the market will go up, down, or sideways. It’s possible to profit in any trend, but only if you know how.
 Today's guest is Karen Stanlake of RangeTraders.com. Karen is going to tell us about the difference between trading and trending markets and some tools she uses in each market condition.

