USDJPY: Reversal or Setback?

Back in September, I shared with you my take on the USDJPY currency pair based on 360° view. A combination of fundamental factors and technical factors has supported the continued strength of the U.S. dollar relative to the Japanese yen.

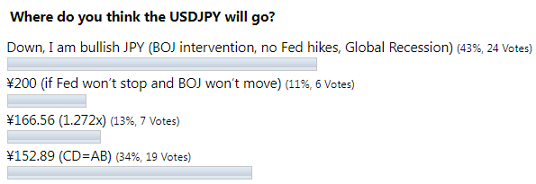
However, the majority of readers predicted the opposite, as you can see in the screenshot below.

Poll Results

As the second largest vote played out the best, the USDJPY has soared more than six percent to reach a peak of ¥151.94. The previous time this level appeared on this chart was in the summer of distant 1990, two decades ago. That move was close to hit the CD=AB target at ¥152.89, however it has lost the momentum.

The pair has lost more than it gained in that call and there is a question, is that all or are we just in a large correction?

I prepared for you another bunch of visualizations below to answer that question.

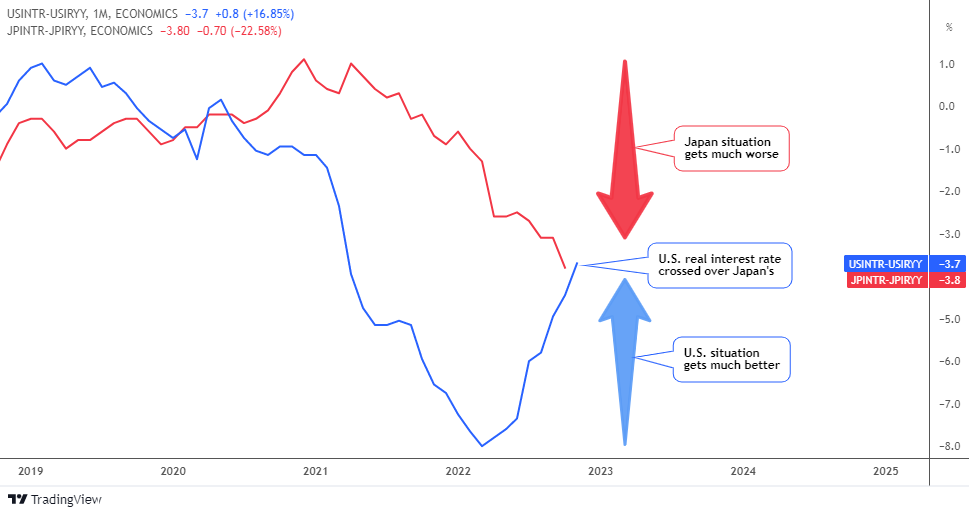
Let’s start with the fundamentals first in the interest rate comparison below.

US vs JP Real Interest Rate

Source: TradingView

Continue reading "USDJPY: Reversal or Setback?"

Where do you think USDJPY will go?

The Japanese yen is the second largest component of the Dollar Index (DX). It occupies 13.6% of it.

The real interest rate differential is the main reason behind the current severe weakness of the yen. I have already visualized it for you in my earlier post in August.

The Bank of England (GBP, 3rd largest part of DX) and lately the European Central Bank (EUR, the largest component of DX) raised their interest rates significantly during the last meetings. The Bank of Japan (BOJ), the Japanese Central Bank has kept its negative rate of -0.1% since 2016. Moreover, it repeated that it would not hesitate to take extra easing measures if needed, falling out of a global wave of central banks tightening policy.

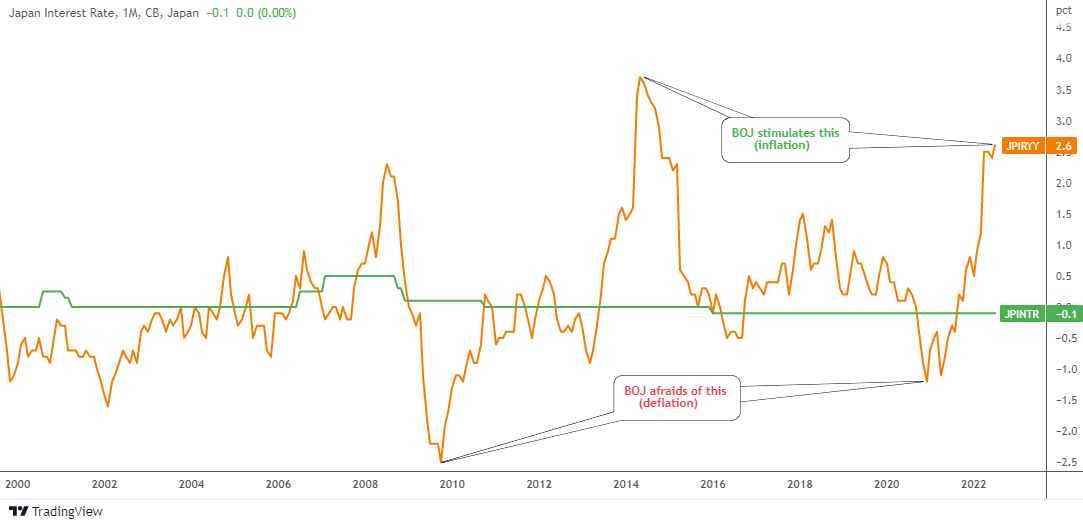
Why BOJ is so dovish? There are several reasons. One of them, the history of inflation as shown in the chart below.

JPN Interest Rate VS Inflation

Source: TradingView

Japan has had a chronic deflation since the 1990s after the asset bubble burst. We can see how short term spikes of inflation (orange line) into the positive territory were short-lived. The BOJ didn’t even touch the interest rate in spite of inflation that has soared to unseen levels of 3.7% in 2014. This time around, the inflation didn’t race to the same peak and as I wrote above, the BOJ thinks of an opposite – easing!

The BOJ governor Mr. Kuroda said in the summer “If we raise interest rates, the economy will move into a negative direction.” The Japanese Central Bank does not want to cause a recession as the economy is still fragile.

Maybe the next chart could clarify the logic of the BOJ. Continue reading "Where do you think USDJPY will go?"

Forex Traders: The Only Question You Should Be Asking

By Elliott Wave International

I can't help it. Whenever I read the mainstream financial news, I feel like I'm eavesdropping on a job interview at Microsoft.

In case you don't remember -- Microsoft was made famous, in part, for asking prospective employees one single question: Why is a manhole cover round?

They wanted to assess how a person approaches a question that has many answers. And, many answers are what they got, from the most practical (i.e. "Because a manhole is round") to the most philosophical (i.e. "The circle is the most aesthetically pleasing shape for the human eye.")

I'll now take you back to the world of mainstream finance where those in charge are regularly asked to answer this basic question: Why did market "X" move this way today? And, many answers are what they give.

Take, for a real-world example the March 9-10 upsurge to a 7-and-1/2 year high in the Dollar/Yen currency exchange pair. As for why the USDJPY rallied, the experts offered up these (and many more) explanations: Continue reading "Forex Traders: The Only Question You Should Be Asking"

USD/JPY: Lemons into Lemonade

How Elliott wave analysis helps you as a forex trader with built-in, risk-defining safeguards

Elliott wave analysis is not a crystal ball. (No market-forecasting method is.)

But here's what is remarkable: Even when your Elliott wave forecast doesn't pan out, you have built-in safeguards to alert you -- and help you manage risk. Here's a real-life example.

Going into the November 14 low, USD/JPY charts had been showing an impulsive downward Elliott wave pattern. Impulses are 5-wave moves, but on November 13-14, the pattern looked incomplete: the fifth wave down seemed to be missing.

Here's a chart our Currency Specialty Service subscribers saw early on November 13: Continue reading "USD/JPY: Lemons into Lemonade"

Fibonacci Range Expansion Trading Zone

Our guest today is Tom Strignano, a former Chief Bank Dealer with 25 years experience. He has also been featured on The Forex Signals. Follow Tom as he shows you a technique he developed back in the 1990's incorporating Adam's favorite Italian mathematician, Leonardo Fibonacci.

-------------------------------------------------------------------------------------------------------------------------------

The Fibonacci Range Expansion Trading technique is one that I developed back in the early 1990s when I was moving away from lagging indicators like RSI, MACD, moving averages etc. I had no success using those indicators and came to the conclusion that either I didn't understand them, or that they simply didn't work. The only thing that I had any success with was trendline breaks, Fibonacci points, and standard pivots with the reading of pure price action. I was taught that in order to be successful in this business of trading, you need a few components.

According to my mentor and senior treasurer, Aldo Pizzoferrato, trading required BMG, or Brains, Money, and Guts. You need the brains to anticipate market momentum and to be a step ahead of the herd. You need capital to advance, and finally, you need the guts to believe in yourself and your systems. Therein lies the problem for most traders. Most traders operate on the simplest level. They have no real trading plan and view charts and price action using gut feel or really just guesswork. Aldo stressed upon me that the most effective approach was acting like a quarterback of a football team. I need to send the signals, by reading the market and finding weakness in the markets’ defenses. He would always say, “Don't just receive the signals, send the market some feedback.” I had learned that trading is not a spectator sport. In other words, the most effective approach is in the development of systems that generate buy and sell signals. I had to move from "chart artist" to a true technician. Continue reading "Fibonacci Range Expansion Trading Zone"