
 If you follow our blog, then you are definitely familiar with trader Larry Levin, President of Trading Advantage LLC. We have gotten such a great response from some of his past posts that he has agreed to share one more of his favorite trading tips as a special treat to our viewers. Determining the direction of the market can be tricky and just plain confusing at times, but Larry’s expert opinion keeps it simple and straight-to-the-point. If you like this article, Larry’s also agreed to give you free access to one of his top trading secrets.
Today he's going to talk about using technical indicators to find potential trading opportunities.
If you know your way around a price chart (Tip#5) then you are ready to learn a little more about technical analysis. This kind of analysis is defined as an attempt to try to forecast price movements based on patterns observed in price changes on charts, or other changes that are not rooted in fundamental observations.
For technical analysts the key to observing the market lies in signals and patterns
Technical analysts (or technicians as they are sometimes called) are looking for all kinds of things in the rates of price changes, the patterns that price changes might be making, shifts in volume and open interest, and more! They are trying to find anything that could be used to show a potential trading opportunity - something that could help them forecast possible future movements. It is important to add a disclaimer here – Past performance is not necessarily indicative of future results. There is no way that finding a pattern or indicator in a chart will be a guarantee of what will happen in the market. They are all subject to the same personal bias and are just as fallible as any other forecasting method.
Why would anyone use technical indicators?
Technical analysis is a means of trying to decipher the market trend or a possible reversal of that trend. Like any other kind of analysis, it is meant to be used in tandem with other observations, ideas, and fundamentals to give a bigger picture when planning possible trades. Even the most basic patterns in technical analysis can be used for trade entry and exit points. Here are some examples:
An uptrend may be present when there are a run of trading periods with higher high prices and higher low prices. Identify an uptrend, and you might get an idea for a long trade. A downtrend could be characterized by a period with lower highs and lower lows. At that time, you might want to find a place to play a short trade. If the market is seeing pretty equal highs and lows, it could be stuck in a sideways trend or channel. Even those have trading opportunities since the high spots could be identified as overhead resistance, where prices will go and then stop and retreat as selling enters the market. The low prices could be showing you key areas of support when the prices get to a point where buying occurs and the market doesn’t seem to go any lower.
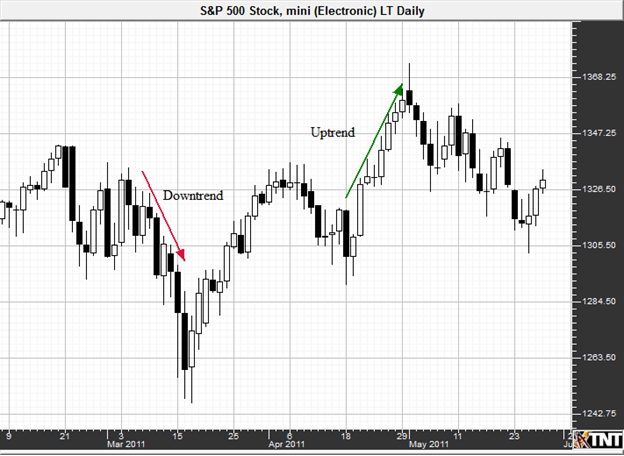
Past performance is not necessarily indicative of future results. Chart courtesy of Gecko Software.
Support and resistance offer interesting entry or exit opportunities. It would be a much more improbable trade if you decided to go long (buy a contract) right as the market was hitting an area of potential resistance. Likewise, it might be riskier to enter a sell order just as the market is getting to an area previously known as support. This isn’t to say that your trade wouldn’t work, it is just good to know these spots and understand what is behind them – it’ll make designing your trade a little more effective. Perhaps you would want to play these areas in case support or resistance is forecast to be broken based on your fundamental analysis or a piece of news due out in the market; or, perhaps other technical signals are telling you that the trend is about to be broken. Here are some other basic signals technicians might look for:
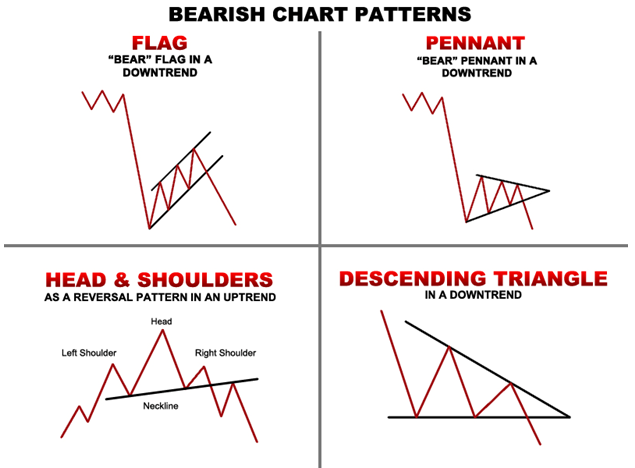
Head and shoulders patterns are formed when the market prices make a peak (first shoulder) and then decline, subsequently rise above the former peak (the head) and decline again, and finally make another peak (shoulder) not higher than the head and decline once more. This pattern is seen as a possible trend reversal. It is a bearish pattern in an uptrend.
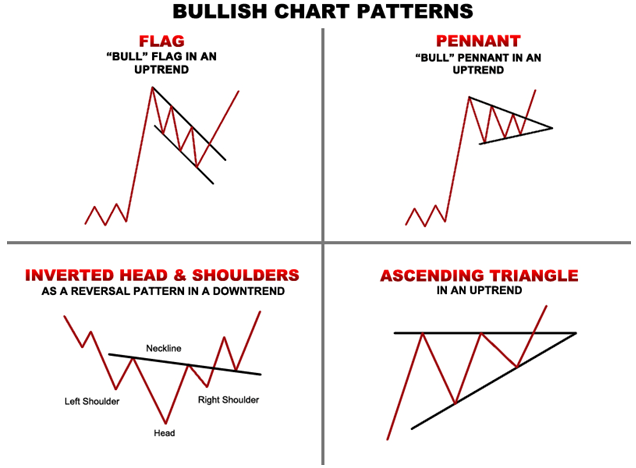
Inverse or reverse head and shoulders are also possible, marked by spikes downwards and then recovery resulting in the reverse should-head-shoulder pattern described above. This is seen as a bullish pattern if it occurs in a downtrend.
Triangles, pennants and flags are also key patterns technicians keep an eye on. They can be bullish or bearish depending on the prevailing trend and the way they are formed. Flags and pennants are seen as signals of a continuation where the market sees a kind of consolidation of action before making a move in another leg of the trend. Volume also comes into play with flags and pennants, usually lower or weakening volume.
Find patterns, find a trade
If you can back up your trading bias with actual technical observations or patterns that might indicate the market is trending or about to see a reversal, then you have a trading opportunity! Rather than boldly (and blindly) placing buy or sell orders and hoping the market moves in your favor, taking the time to learn and understand how the market behaves can make or break your trade design. Other people are looking at the same information and furthering your education can never really be a bad thing!
Click here to see one of Larry’s top trading secrets!
Best Trades to you,
Larry Levin
Founder & President- Trading Advantage
[email protected]
Disclaimer: Trading in futures and options involves a substantial degree of a risk of loss and is not suitable for all investors. Past performance is not necessarily indicative of future results.
the triangles missed an almost 200pt rally in the S&P already.
MIchael,
Thank you for your feedback.
Please do not be critical of a service that you do not subscribe to and are not a member of. The videos I provide for free, are educational and do not offer specific trading advice. MarketClub members enjoy all the benefits of our club, including our Trade Triangle technology, plus the access to three very successful trading portfolios. You have no one else to blame but yourself if you lost money in the market. You probably were not using any kind of money management control on your position. You can try out MarketClub for $8.95. If you can't afford that, then you should not be reading this page or trading as it will cost you a lot more by not learning how to trade properly.
Adam
I agree. The trade triangles are too late to do anything with.
I agree.
When does the monthly trend go up ?
After a Huge rally, when the monthly trend does decide to go up, and I buy into that, that will probably be when the market is at the top, and the daily triangle will go red. The monthly triangle takes forever to do anything, and usually by that time, it is too late.
dina
The problem lays in how to interpret those chart patterns. Each of those patterns must be read in the context of the major trend. Is the major trend in equities up or down? I say it's up, someone else is going to say it's down.
BTW, when do we get a green monthly triangle? We must be there already.
Jackson,
Thank you for your feedback.
Please do not be critical of a service that you do not subscribe to and are not a member of. The videos I provide for free, are educational and do not offer specific trading advice. MarketClub members enjoy all the benefits of our club, including our Trade Triangle technology, plus the access to three very successful trading portfolios. You have no one else to blame but yourself if you lost money in the market. You probably were not using any kind of money management control on your position. You can try out MarketClub for $8.95. If you can't afford that, then you should not be reading this page or trading as it will cost you a lot more by not learning how to trade properly.
Adam