We've asked our friend Jim Robinson of profittrading.com to provide his expert analysis of charts to our readers. Each week he'll be be analyzing a different chart using the Trade Triangles and his experience.
Today he is going to take a look at the technical picture of Australian Dollar/Canadian Dollar (AUDCAD).
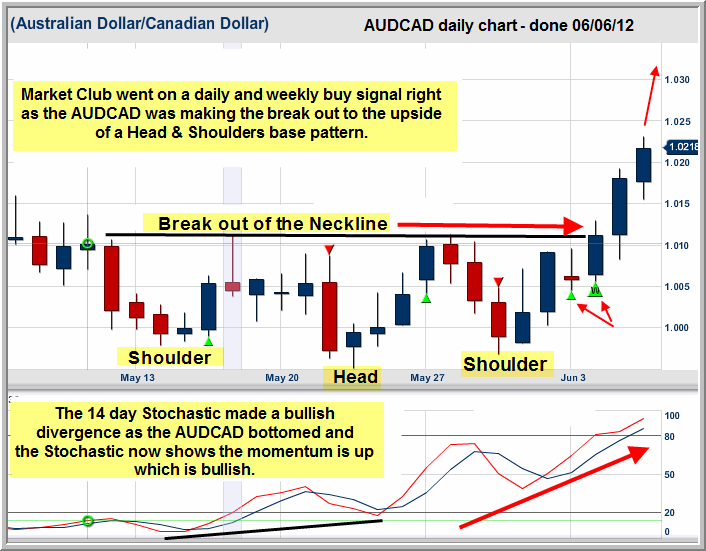
It is interesting to see that classic chart patterns that were originally used in the stock market like the Head & Shoulders base,play out in all markets including Forex.
The reason these patterns work in all markets is that the patterns are tracing out the human emotions and human emotions are the same no matter what market you are trading.
On the AUDCAD chart MarketClub put in a daily Trade Triangle buy signal right before the break out of the Head and Shoulders base.
MarketClub then put in a weekly Trade Triangle buy signal right at the break out of the neckline.

As you follow classic chart patterns and MarketClub's Trade Triangles I think you will see that the MarketClub signals often come in right at a classic entry point for that chart pattern.
Thanks,
Jim Robinson
Profit Trading.com

Aldo and Jim,
Great advice! I have been trading for quite some time and using the support resistance pivot points and the trade triangles are awesome for entry points. Example: LULU hit a yearly R2 pivot point and I wanted to find a good entry point and used the daily triangle to enter my short. I have done the same with SBUX. I have profits locked with stops. Put's on RL have been my best winner and I used the daily triangle for entry. I have been following the trade tiangle for almost a year now and finally decided to become a member of Market Club recently. They work very well for me.
Hi there Paul
In respect to your comments regarding Stochastics,I think you should keep well away from 'lagging' indicators. Price action is the only indicator I use, all the other garbage indicators out there are all the same, from CCI to MACD to RSI, they all give signals AFTER the event and I think these culprits lose more money for amateur traders than anything else. Pro traders don't use any of these for positioning themselves in the the market, they use PRICE ACTION only, combined with support and resistance, and until you get away from these 'gimmicks' you will be lacking definition of purpose. If you look at the chart above, the resistance was broken with a very bullish candle and you had the 'Trade Triangle' kick in, that' s all you need! K.I.S.S (keep it simple stupid). Trading is all about simplicity, NOT hundreds of indicators being 'oversold' this, 'overbought' that. You can drive yourself insane wondering if you should enter a position or not. Have you noticed when people tell you about 'divergences', they are about three days AFTER the event. How do you know it's a divergence, it could very well turn the other way! A nice simple chart, Trade Triangles and observation of support and resistance zones are all you need my friend, then, and only then, will you start to make real money at trading.
I hope this helps and all the very best in your trading Paul.
Sincerely
Aldo
I appreciate the comments. And yes Aldo, I have done scores of back tests with stochastic oscillator on many time periods, only to find you will eventually lose what you make, and miss some good runs as well. They certainly do not work well alone. I take it you are pleased with the trade triangles. I have been curious or quite some time.
I have a hard time with this sort of trade. I find it hard to by when the stochastic is over 80. How do you know they won't just turn around? Yet if you trade on breakout, it seems only logical that that the stochastic will be in that territory. If you hold till it goes below 80, it just might keep on going and you miss lot of the trade.
Paul,
Hi !
When I did the chart I wasn't suggesting
to buy at the current high point on the chart.
I was more showing how the price action was playing out with
a classic chart pattern and the Market Club Triangles.
If you would have seen that the chart
looked to be making a Head and Shoulders bottom
you could have possibly anticipated the coming break out
and taken either the daily or weekly Market Club buy signal
to get into the trade before the big run up.
I hope that helps !
THANKS !
Jim Robinson 🙂 Profit Trading.com