
 Each week Longleaftrading.com will be providing us a chart of the week as analyzed by a member of their team. We hope that you enjoy and learn from this new feature.
As we begin another week of trading in Gold Futures, traders are wondering if the hangover from Fridays disappointing jobs number (third month in a row where the US economy produced fewer than 100,000 jobs) will continue to pressure precious metals. So far the August futures held Fridays low, but are yet to provide a convincing rebound before the open in New York. Traders are also focused on any news from today’s Eurozone Finance Ministers meeting in Brussels, but are not expecting any major revelations. Throughout this week, Gold traders will also be paying close attention to the start of earnings season in the United States as the FED is still undecided on whether to inject another round of easing at the next FOMC meeting.
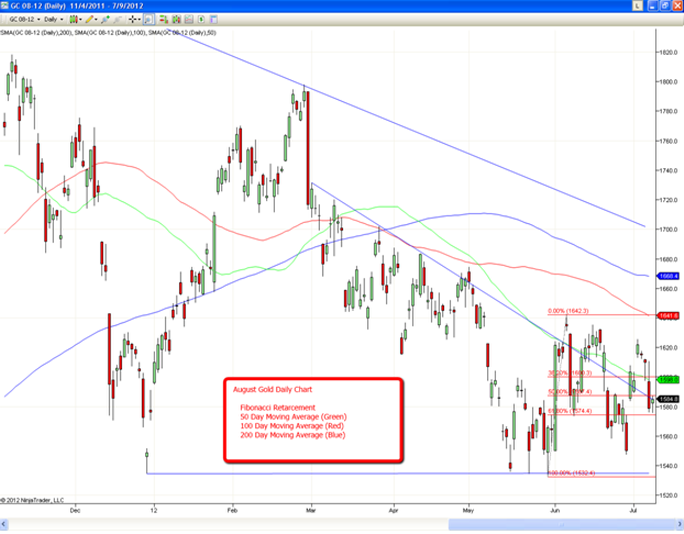
From a technical perspective, (see chart) the August Gold is in a range between $1530 and $1640. You will notice that prices tested last Decembers low three separate times in the month of May before hitting the $1640 high, and has been very choppy since then. The low prices from Friday and today seem to have targeted the Fibonacci 2/3rds retracement, but fail to convince me of a directional play yet.
I believe that this week’s trade in the Gold market will depend mostly on how the earnings are reported in the US. After seeing how much the jobs number affected Gold on Friday, I have to believe that the same rules apply this week. As mentioned earlier, the FED is still deciding whether or not to ease again. As backwards as this may sound, a string of disappointing earnings may tempt traders to try to get ahead of the FED and begin buying markets like Gold that would be favored by a weaker US Dollar. In today’s trade, the Dollar is attempting to test the June high, and the Euro is trying to hold the June low. If these two markets stay tamed, we should expect a choppy Gold trade as well. I believe that Gold traders will continue to hold prices in this $100 range until the FED decides whether to stimulate again with another round of easing. This week should then provide both day and swing traders with decent opportunities to scalp.
Good luck this week.
If you have any questions or comments, please feel free to contact me directly at my office email [email protected] or by phone at (888) 272-6926. I will be happy to hear from you.
Thank you for your interest,
Brian Booth
Senior Market Strategist
888.272.6926
I
personally, would like to see what silver is doing in the future
Ken