
We've asked our friend Jim Robinson of profittrading.com to provide his expert analysis of charts to our readers. Each week he'll be be analyzing a different chart using the Trade Triangles and his experience.
Today he is going to take a look at the technical picture of Qualcomm Inc. (QCOM)
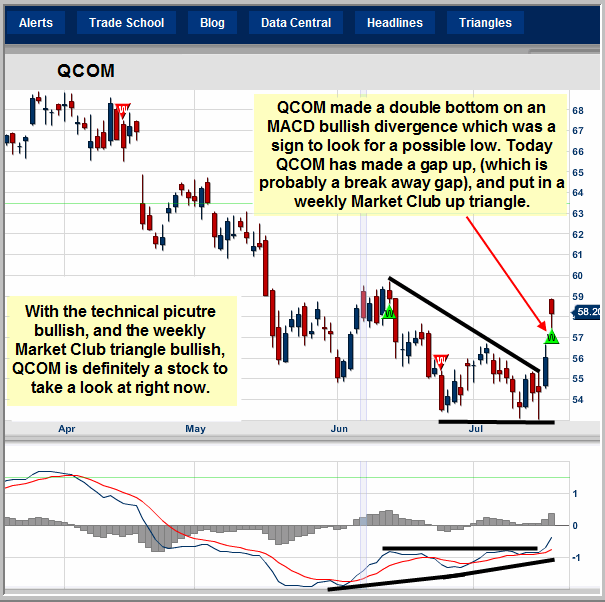
QCOM put in a double bottom,as the MACD made a bullish divergence.
A bullish divergence is always a place to look for a trading low to possibly come in at.
QCOM has made a strong gap up Thursday (07/19/12).
There are 3 kinds of major gaps :
#1 - A Break Away Gap
#2 - A Mid Point Gap
#3 - An Exhaustion Gap
Thursday's action looks to be a break away gap, and break away gaps normally lead to higher prices.
QCOM put in a weekly green Trade Triangle on Thursday's bullish gap up, which also suggests a low could be in.
QCOM is definitely a Chart to Watch !
Thanks,
Jim Robinson
Profit Trading.com
Entry point for QCOM to go long ?
Please take a look at VHC on the ASE. Today was expiration day. Has no debt and is going to $100 shortly!!
your short term read?..........................dma
Hi !
QCOM is filling the gap and testing the low, which stocks will often do
after a big move off the low.
Wait and see how QCOM plays off the test of the gap off the low,
and that should give you a lot more information as to if QCOM
will continue higher or lower.
THANKS !
Jim 🙂