We've asked our friend Jim Robinson of profittrading.com to provide his expert analysis of charts to our readers. Each week he'll be be analyzing a different chart using the Trade Triangles and his experience.
Today he is going to take a look at the technical picture of December Corn (ZC.V12.E). I hope you had a GREAT week !
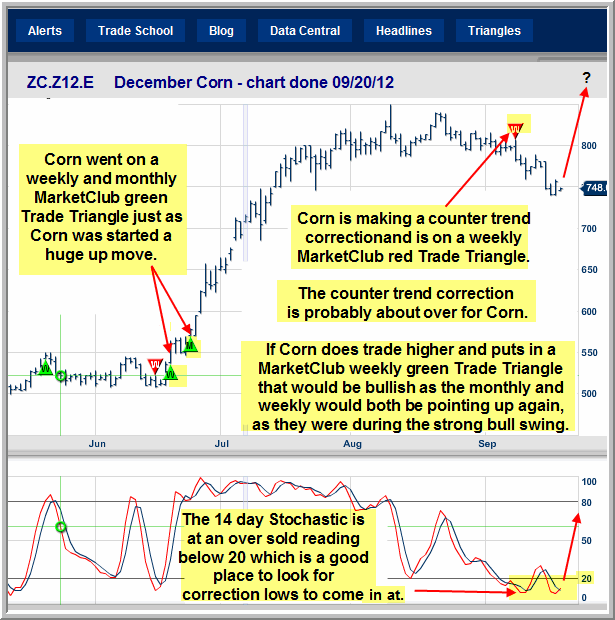
Corn is currently in a counter trend correction and has gone on a weekly red MarketClub Trade Triangle which reflects the counter trend move.
The monthly MarketClub Trade Triangle is still green which means the longer term monthly trend is still bullish for Corn.
The counter trend correction is probably close to being over.
If Corn does move higher from here and MarketClub puts in a weekly green Trade Triangle that would help to confirm that the counter trend correction is probably over.
When the weekly and monthly MarketClub Trade Triangles are both green that is bullish and Corn would be a great Chart to Watch !

Thanks,
Jim Robinson
Profit Trading.com
