
Each week Lo ngleaftrading.com will be providing us a chart of the week as analyzed by a member of their team. We hope that you enjoy and learn from this new feature.
Weekly Gold Report (December 17th through December 22nd)
As far as I am concerned, “Holiday Markets” took control last week and it is the best way to describe what we witnessed in Gold. In Europe, a deal in Greece was reached which underpinned the Euro and dropped the US Dollar. Later in the week, the Federal Reserve pledged to keep interest rates at close to zero until unemployment falls below 6.5%, which is new to their monetary policy. It is the first time ever that Interest Rates were pegged to one area of the U.S. Economy. Initially after the news broke, Gold Futures rallied and closed in the upper end of the range for the week. But it was not long before early profit taking began and suddenly the market found itself over $30 lower and back at the lower end of the range on lighter volume. And who could forget all of the “Fiscal Cliff” nonsense? Every day (sometimes multiple times a day), through television or social media, the President and the Speaker of the House report to the world that while they are negotiating, nothing is really being accomplished. I can’t speak for the rest of the world, but personally I can not wait for the final decision, not because it will provide a direction for major markets, but because I am tired of reading about both of them and their sophomoric behavior. It seems like suddenly the highest political offices in the U.S. have confused their roles with the highest offices at US (Weekly).
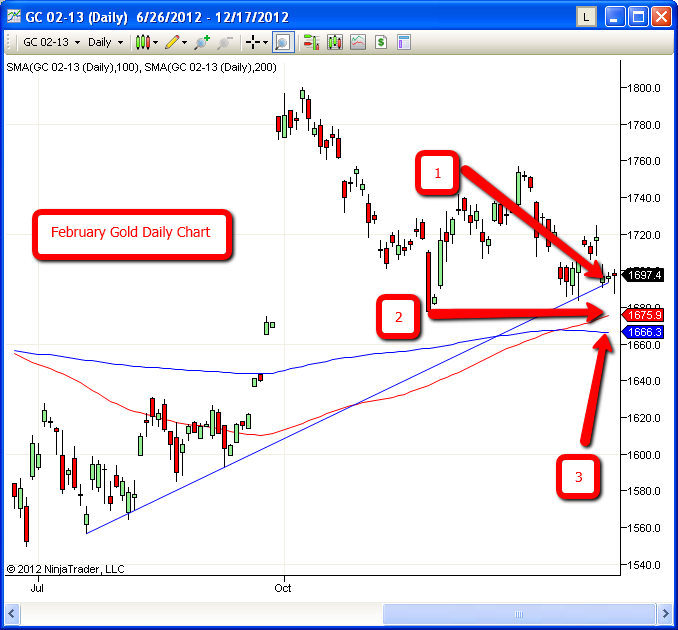
There is no denying that activity and volume are down over the past week, which leads me to rely on technical analysis in the Gold Futures. I stand by an overall bullish bias and I do believe that fundamentals will prevail for those with the ability to stomach a long futures position with a wide stop. For those looking to enter the market with new long positions, there are three support levels seen on the daily chart. Arrow #1 shows the longer term support trendline that the market continues to test, breach, and close above. Gold traders are obviously focused on this as first support. Arrow #2 points out the convergence of the 100day simple moving average and the November 2nd low near $1675, which is the next potential support level. And lastly, arrow #3 is set on the 200day simple moving average, which many traders use as their proverbial “line in the sand”.
Every year around this time, markets overall tend to thin out and traders expect erratic movement. This can be both good and bad, depending on which side of the market you are on. When volumes are light, it makes it easier for a larger lot trade to have a more significant impact on the market. With this in mind, I will use the three aforementioned support levels as a basis for executing long Gold positions with stops below. I will also recommend that stops be adjusted accordingly when the market moves favorably. For all new positions, this is what I feel would be the best way to trade Gold until a final “Fiscal Cliff” deal is decided.
Good luck this week traders! As always, feel free to contact my office directly if you would like to discuss Gold or any other Futures markets with me. I can be reached by phone at (888) 272-6926 or by email at [email protected].
Thank you for your interest,
Brian Booth
Senior Market Strategist
[email protected]
888.272.6926
This drop of price in gold and siver should bring smile onto the face of any serious investor.It may drop even a bit more but it won´t last for too long.Marvelous opportunity to buy more.Martin
Martin, I agree. I am hard pressed to believe that suddenly Gold has decoupled from its normal outside market influences. This to me feels like profit taking and squeezing in light volume. As soon as the pressure has buyers feeling totally defeated, there will be a huge reversal.
Still considering "hope, hope and hope only? if bull run can be continued for more then 12 years, why, how and on which ground bear face furnish in short span?
Rasesh Shukla - India
What counts in next 3-4 years is number of ounces of physical gold and silver you own.Even the traders should put some aside.Martin
Even a broken clock is correct 2 times per day.
Any Clear ideaabout this?
Rasesh, with the way the market has (or should I say has not) performed over the last few days, it is impossible to give specific recommendations. I have recommended both long and short intraday positions and neither have been game changers from a profit perspective.
Futures markets like the Metals and Crude Oil have thinned out, which can make watching the market comparable to watching paint dry. It also leaves the futures vulnerable to a big move (up or down) on light volume. Many of the commodity futures may be waiting for the final announcement regarding the Fiscal Cliff. And this announcement is impossible to correctly predict in advance.
I feel that the best way to trade in this market is to choose a direction, map out the best prices in advance and be sure to use stop orders once filled. When we have the Fiscal Cliff behind us, we should have the necessary information to make a much more informed decision.
Brian,
Thanks for detail and clear reply.