

Today I prepared an absolutely different look at the Palladium technicals.
Monthly Chart: Palladium Has Halted On The Way Up To $1200
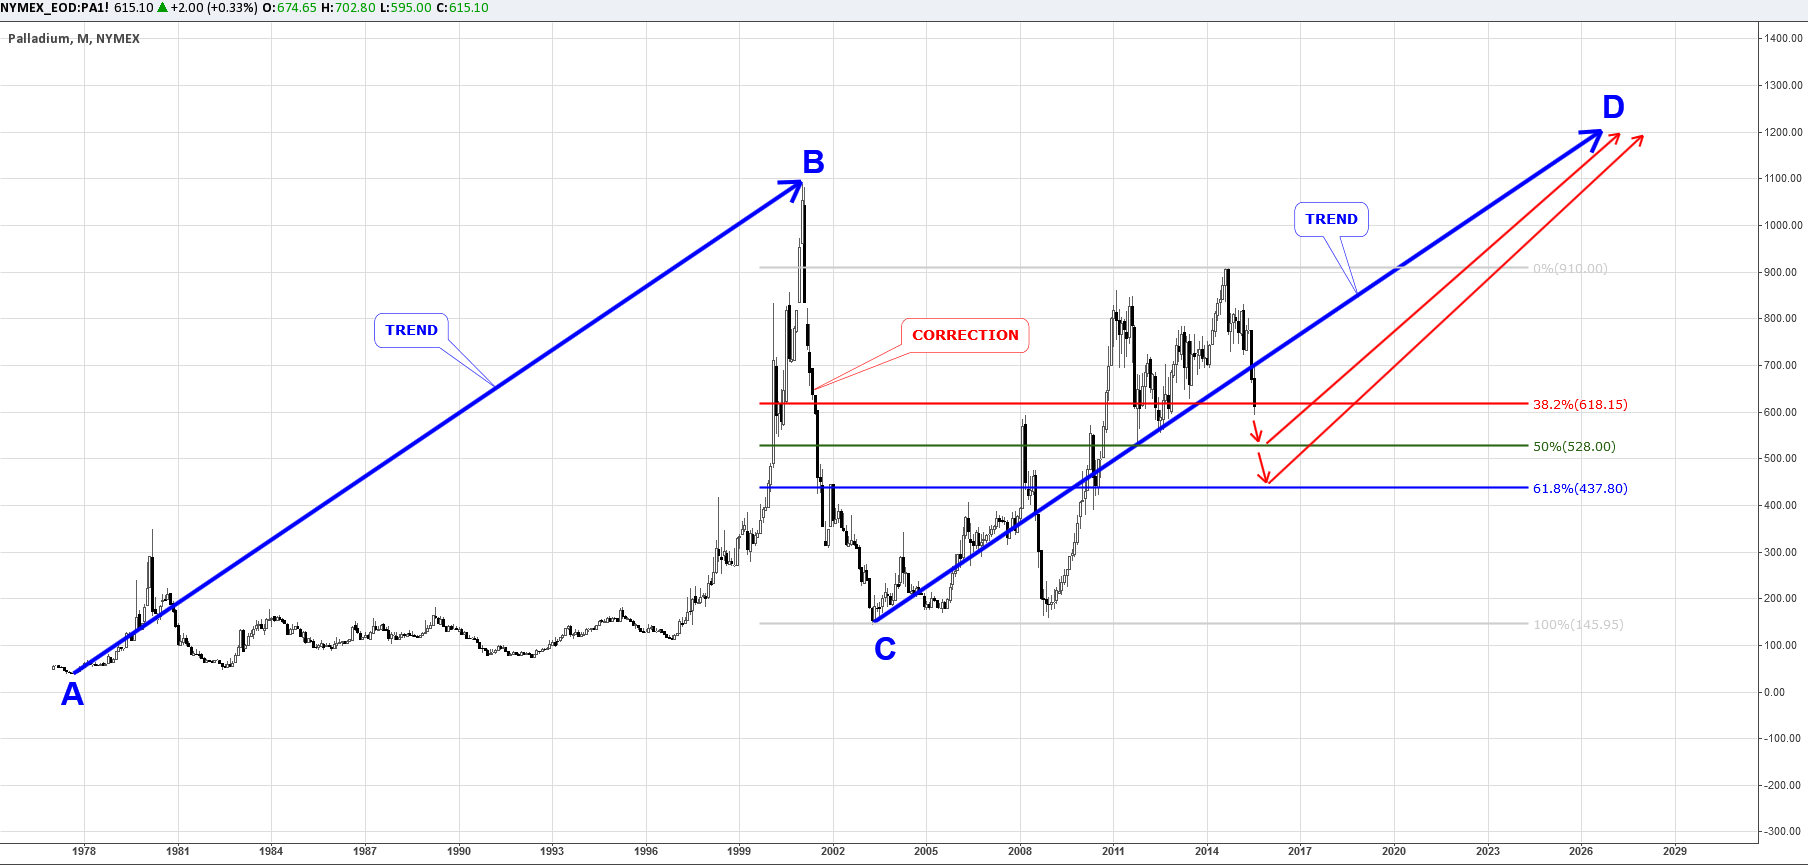
Chart courtesy of TradingView.com
Palladium has been a top performing metal among the precious metals for the past decade. It's the only precious metal to make a new high in 2014 while the others peaked in 2011 and the only metal to build record ETF inventories.
As seen on the above monthly chart, the metal price has shown quite simple zigzags with vertical soaring during the period between 1977 and 2001. Palladium had flown sky-high to $1090 level and then it had fallen in 2002 down to the $145 mark, giving back almost all of its gains. Indeed, it was a bubble burst.
But like a phoenix, the metal started with a quick recovery and reached the breathtaking height of $912 last year. This time the ascending move had more complex zigzags inside of the trend.
I labeled the first move up as the "AB" segment and the current growth cycle is within the "CD" segment, which is equal by distance to the "AB" segment. Target for the "D" point is the $1200 level or double of the level we have now. The "BC" area is a deep correction, but the "C" is still above the "A" level and therefore the market is bullish so far.
The market has reached 3/4 of the target and has entered into a consolidation/correction phase. The price has fallen below the first support at the 38.2% Fibonacci retracement level and would confirm the breach price should close of the month be below the $618 level.
The next level of support is located at the 50% Fibonacci level at the $528 mark. I think sellers will have a tough time cracking this level. The last level of support for the Bulls rests at the $437 level or the 61.8% Fibonacci level. I expect the price to bounce off one of these levels.
Near Future: Bears Are In The Last Swing Down
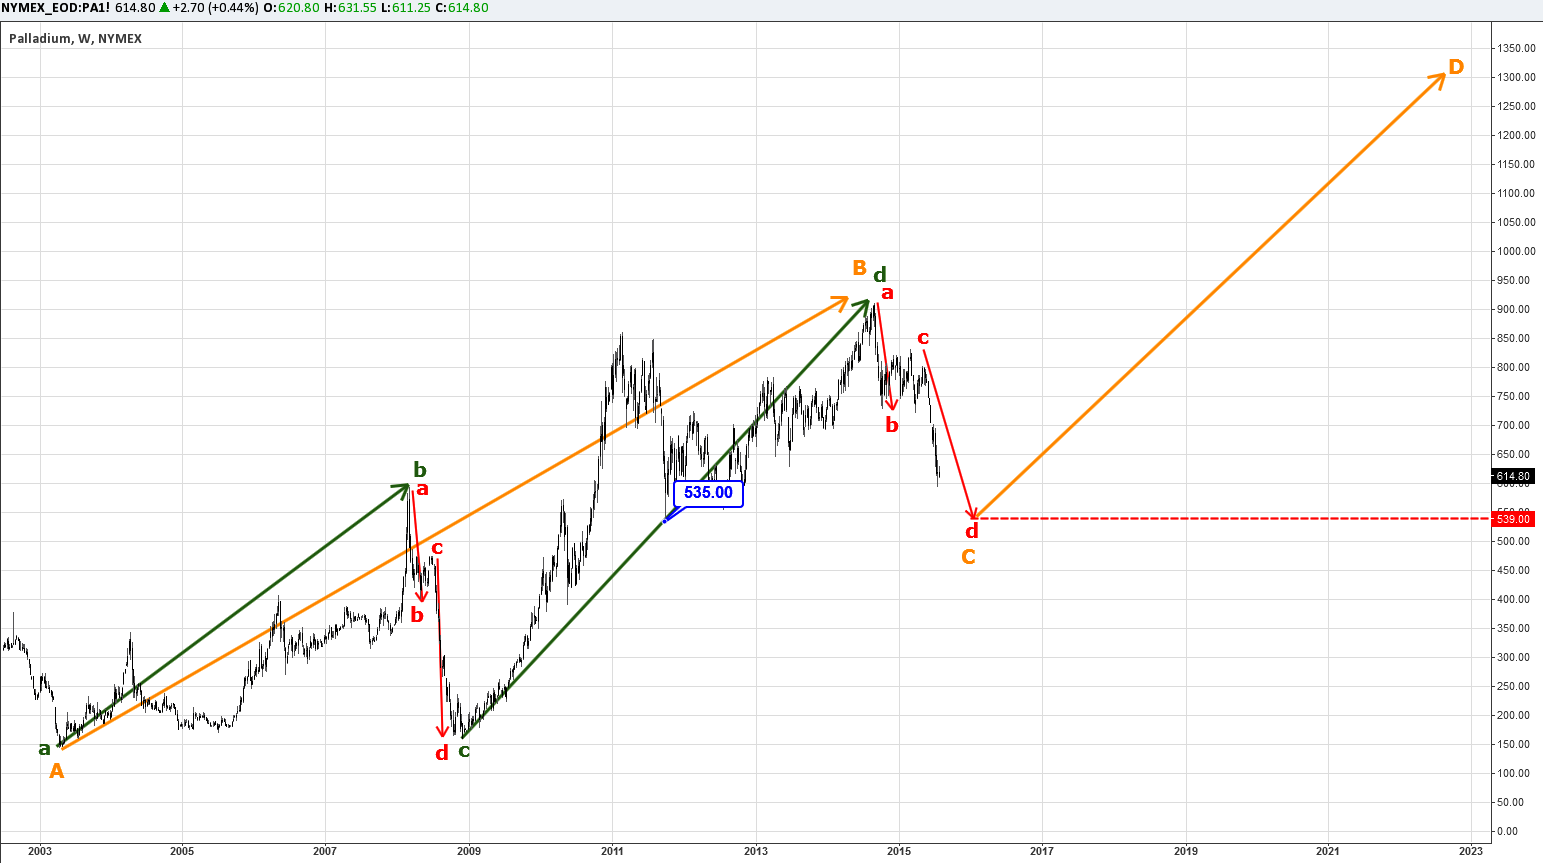
Chart courtesy of TradingView.com
When I was building the chart above, I found common Fibonacci ratios between different segments which once again proves the power of these magic numbers.
For instance, the green "cd" segment is 1.618 times longer than the green "ab" segment. The left red "cd" segment down is also 1.618 times longer than the left red "ab" segment. This will help us measure the current correction for better trading signals.
The monthly blue "CD" segment consists of the 2 golden segments depicted on this weekly chart. The golden "AB" segment has been finished and now we are in the correction phase that is highlighted by the two right red segments labeled as "ab" and "cd". Taking into account the past price development of the correction, I have measured the right red "cd" segment as 1.618 of the right red "ab" segment by analogue of the left red segments where "cd" = 1.618 "ab".
The outcome of calculations is highlighted in the red dashed horizontal line at the $539 mark. That is the projected target for the current correction. This level should be quite powerful as the previous correction had been stopped just below the $535 level (highlighted in blue price label call out) and the 50% Fibonacci level is also slightly below at the $528 level.
If we clone the golden "AB" segment and then put it from the right red "d" point upside we will get the golden "CD" segment with the target at $1300, even higher than on monthly charts. At least the targets are not in contradiction and the weekly chart target overlaps the monthly chart target.
So, Bulls keep patience, Bears be warned.
Intelligent trades!
Aibek Burabayev
INO.com Contributor, Metals
Disclosure: This contributor has no positions in any stocks mentioned in this article. This article is the opinion of the contributor themselves. The above is a matter of opinion provided for general information purposes only and is not intended as investment advice. This contributor is not receiving compensation (other than from INO.com) for their opinion.