

This time I want to share with you the technicals of the Gold/Stock index ratios for the United States and Europe.
Chart 1. Gold In Usd/S&P 500 Index Ratio: Landed or Not?
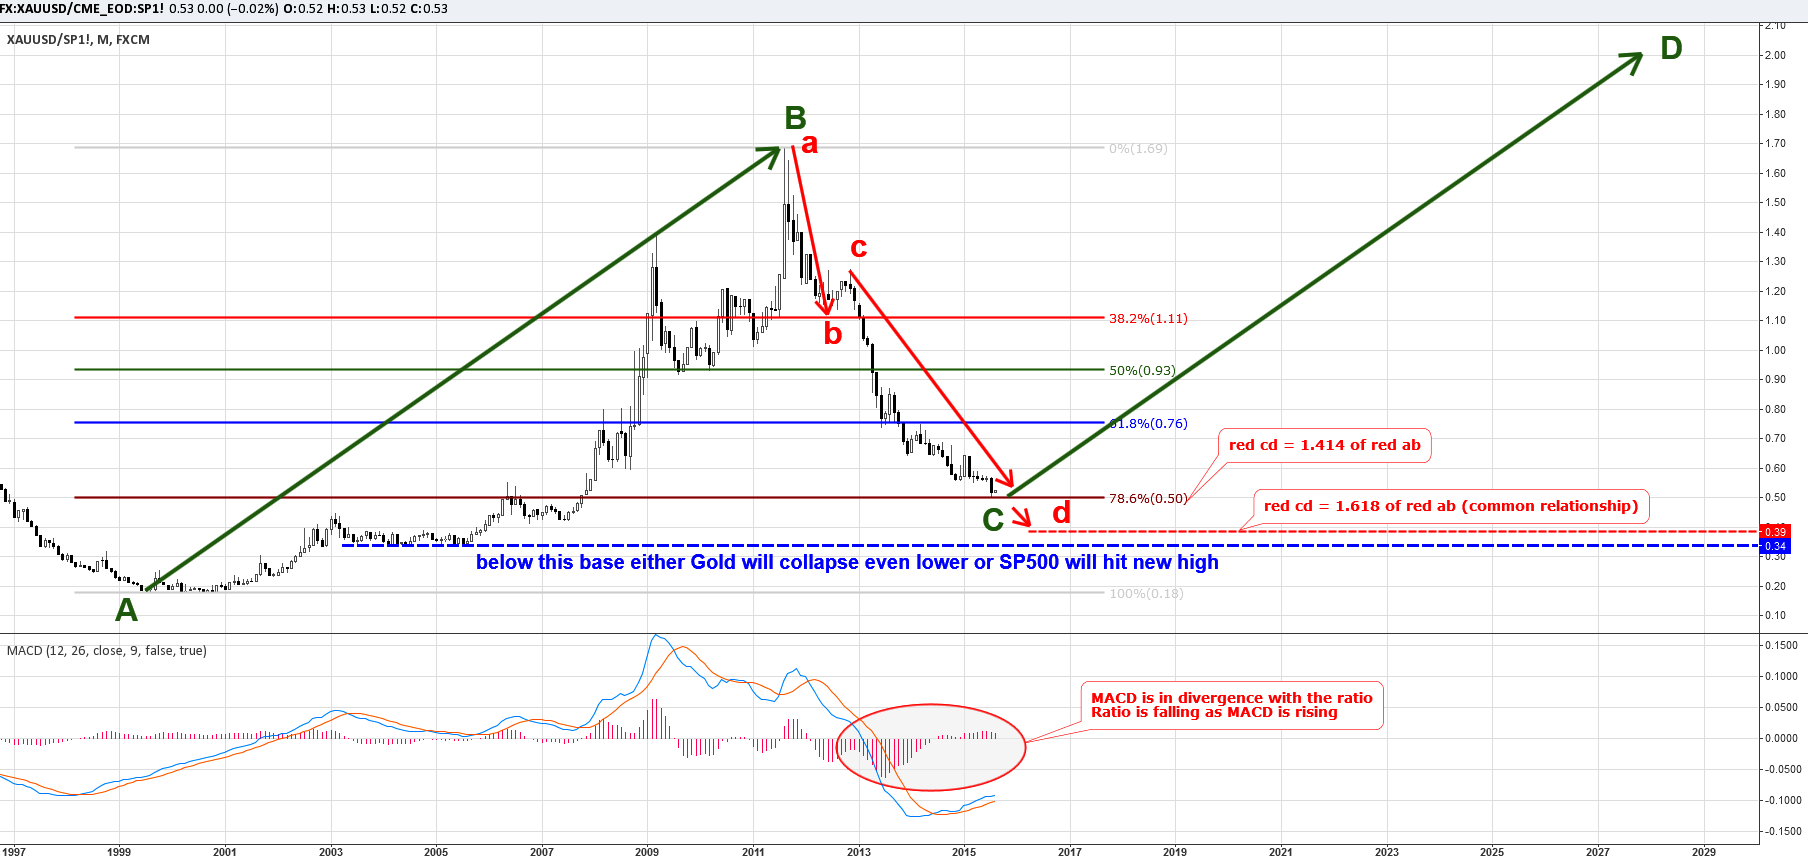
Chart courtesy of TradingView.com
As both Gold and stocks are hitting new multi-year extremes, I wanted to compare them in the form of a ratio to better understand where we are now on the chart.
This year the S&P 500 index pushed Gold down to a decade low just like the US dollar did. The chart looks similar to the Gold/$ chart, but the index has surpassed the currency. The Gold/S&P500 ratio corrected for a huge 78.6% setback while the Gold/$ ratio only corrected for a 50% setback, which means that stocks outperformed the cash.
From 2000 when the ratio bottomed at the 0.18 level, Gold is still in a surplus of value at the current 0.5 level compared to the stock index despite the collapse. That should console long term Gold investors and bugs.
On the chart above, it's clear that the current correction is fading. The first warning signal is the MACD divergence. The MACD bottomed in 2013 while the ratio made a new low last month. The faster blue line of the MACD has crossed up the slower orange line and the pink histogram turned positive in 2014, cooling further aggressive downfall. We can already see the outcome – the ratio has lost almost a year in sideways consolidation before hitting a new low.
Another factor pointing to the end of collapse is the depth of correction; the ratio has stopped right at the 78.6% Fibonacci retracement level which is an important support level. By the way, it coincides with the red ab-cd correction when the red cd segment is 1.414 (Fibonacci number) times longer than the red ab segment.
If the cd segment advances to 1.618 times of the ab segment, then the ratio can fall another 0.11 units to the 0.39 level. That is just above the base 0.34 level from which the ratio soared to 1.7. This is a very important area, below we will see new a low in Gold or a new high in S&P 500 or both scenarios at once.
The target for reversal is quite ambitious, but we are talking about core financial instruments of the world and anything can happen, even if we will get into uncharted territory like the S&P 500 did this year. If we clone the green AB segment and put it to the current low, we will get to the 2.00 level which is four times greater than the current ratio. If the red segment reaches the 0.39 level, then the target will aim at the 1.89 level. Anyway, all this points to a higher value of Gold compared to the stock index.
If Gold gets stuck at the current levels for a long period of time as it did during 1984-2005, then the S&P 500 can hit the 500 level. As one of the top traders said: a successful trader should have the imagination to see unbelievable prices.
Chart 2. Gold In EUR/DJ EURO STOXX Index Ratio: Similarity of Global Markets
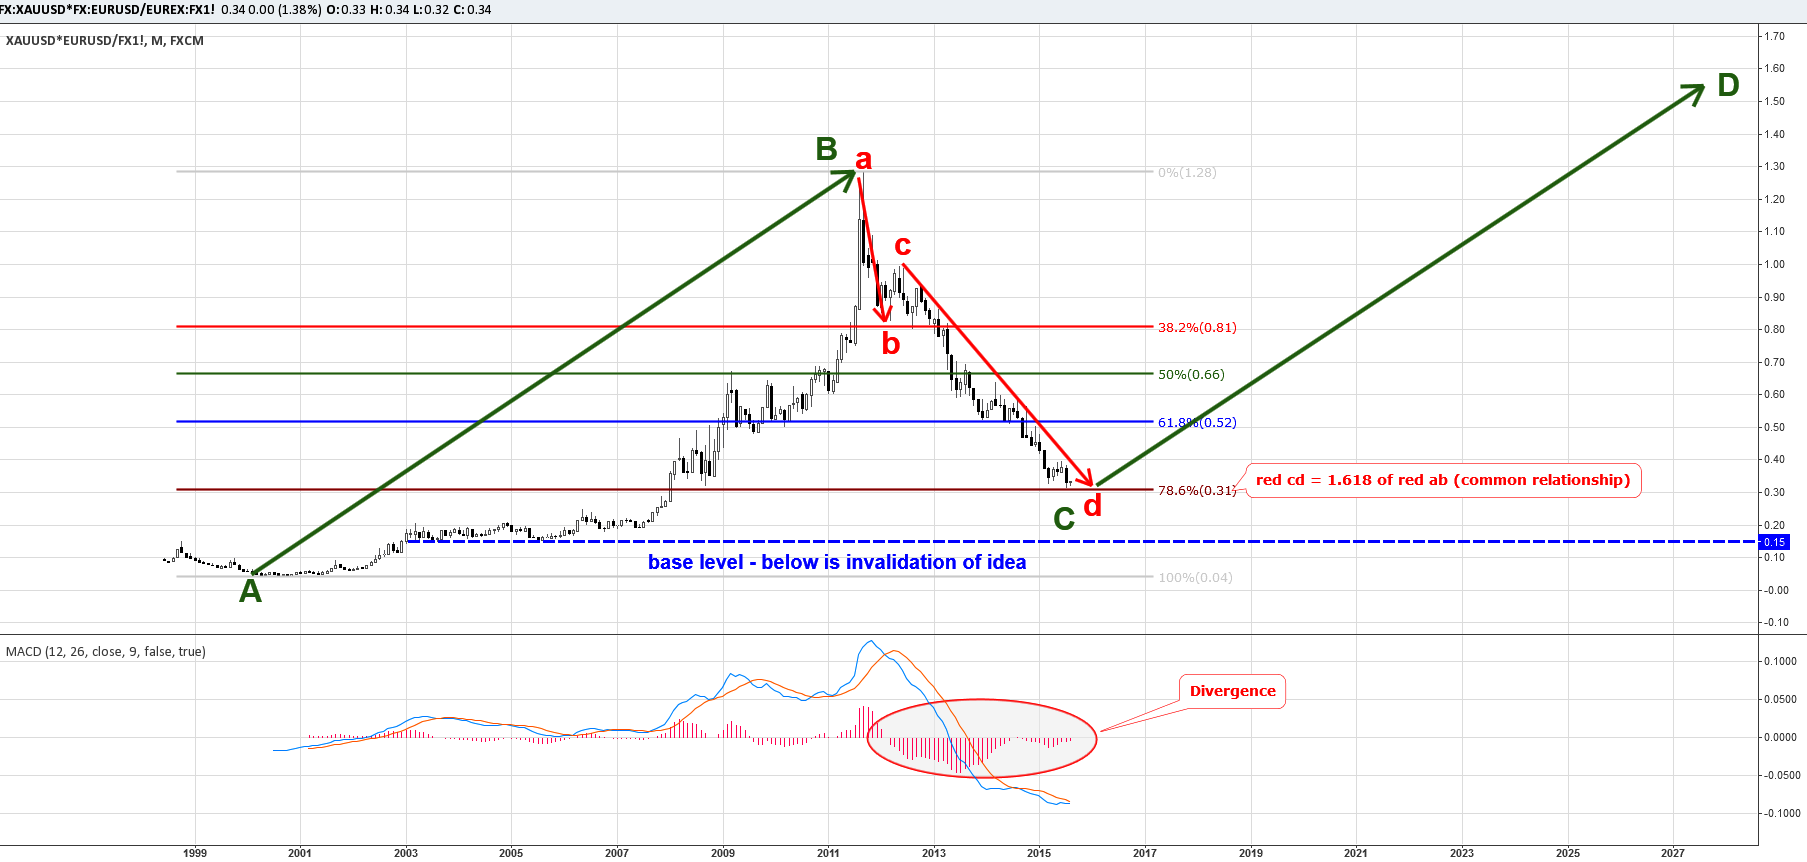
Chart courtesy of TradingView.com
For the second chart above, I took the Gold/EUR and divided it to DJ EURO STOXX index to see which of the instruments is adding value for European investors in terms of single currency (euro).
I was surprised to see the same picture on the chart as on the US graph (chart 1) despite different currencies and indices. Indeed, globalization equals the markets and opportunities.
The first thing that caught my eye was the similarity of the depth of the current correction; it is the same 78.6% Fibonacci level. The red cd segment advanced exactly 1.618 times of the red ab segment in the correction which lifts the chances of a sooner reversal over the US market. The MACD here, like on the US chart, shows divergence: it didn’t shape a new low when the ratio did.
The target here is more distant than in the US market: if we clone the green AB segment and put it to the current low, we will get the 1.55 level which is more than 5 times greater than current 0.31 level.
Gold/SP500 has only four folds to grow. For me, it means harder times for European stock markets. In this year of stocks, DJ EURO STOXX couldn't hit all previous highs done in 2007 and 2000 amid the money printing and that it is a bad sign.
Overall Gold is still better than currencies, oil and stocks for the long run as we found out from the comparison charts done today and before.
Intelligent trades!
Aibek Burabayev
INO.com Contributor, Metals
Disclosure: This contributor has no positions in any stocks mentioned in this article. This article is the opinion of the contributor themselves. The above is a matter of opinion provided for general information purposes only and is not intended as investment advice. This contributor is not receiving compensation (other than from INO.com) for their opinion.
Gold will not rise until the the last of the goldbugs have gone the way of the dinosaurs. As this one is still kicking, it must be too early...
Alak have you failed as so many gold touts, to adjust your metrics for a bear market? Oversold readings in gold in a bear market are much different than when it's in a bull market and it's just a pullback. As well, hoping for an overall market crash to make up for your heavy losses in metals always sounds good on the face of it, but are you actually selling S&P stocks short and buying puts for instance? If not then why should I follow your advice quite frankly. I know you won't reimburse heavy losses if I buy gold and short dow stocks for instance, but then again I use stop points and lines in the sand to contain losses as not being objective is the road to disaster.
Thank you for this article.
-
Good analysis and well-written.
-
Encouraging for a suffrin' old Gold Bug .
-
SnowieGeorgie
-
-