

The historical stock build from December 2014 through July 2016, and subsequent decline from August through December has led some to conclude that global stocks had started to rebalance. Instead, the normal seasonality in stocks had been masked by the high overproduction of OPEC, but then normal seasonality kicked-in.
Global OECD inventories from past years demonstrate the normal seasonal patterns, with some variability. As shown in the graph below, stocks normal build early in the year and peak around August. Stocks normally drop from September through December.
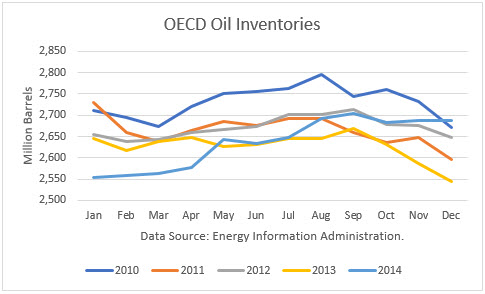
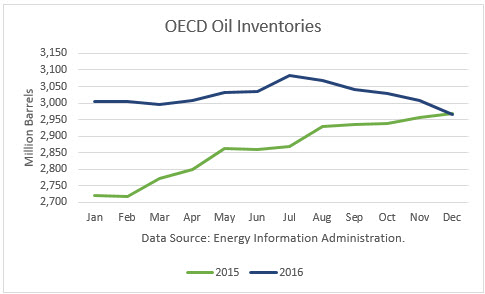
But in 2015, the oversupply was so excessive that stock just kept building through the year. They finally peaked in July 2016, then dropped off due to normal seasonal demand. This normal pattern led to a false conclusion that the rebalancing of stocks had begun.
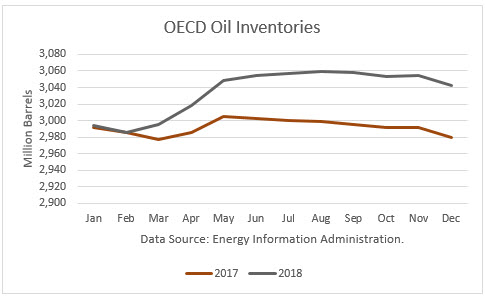
But according to Energy Department data, OECD stocks in March 2017 are 13 million barrels higher than December. And it projects that stocks are likely to peak in May this year, earlier than normal, but to end 2017 with stocks just 14 million lower than a year ago. This is based on the Energy Information Administration ((EIA)) assumption that OPEC does not hold production to its March level. Furthermore, the EIA projects global stocks to set new record highs in 2018, after the OPEC-non-OPEC cuts presumably end.
Effect of Production Cuts
Some argue that the 285 million barrel excess above the 5-year average as of the end of December should disappear in five-to-six months by dividing 285 million by 1.8 million barrels per day, the agreed-upon size of the daily cut. But that math first assumes that supply was in balance with demand, makes no allowance for rising supplies, such as in the U.S., and it does not take into account the seasonality.
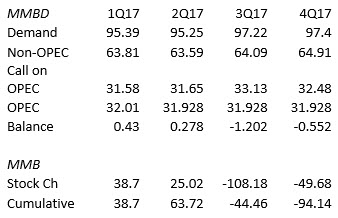
According to OPEC’s figures, global OECD stocks are likely to build both in the first and second quarters, and then decline in the second half of the year, assuming OPEC production remains at the March level.
There was one development last week, if true, did shift the inventory trend lower. The EIA revised its December estimate of OECD stocks down 105 million barrels, a major revision. That reduced the size of the glut to 201 million above its five-year average.
Conclusions
The market dropped sharply in early March as a result of the continued rise in stocks. The market has falsely expected to see inventories to soon decline as a result of the production cuts. But seasonal factors need to be taken into account. We should see global stocks decline in the second half of 2017, assuming OPEC extends its cuts. And the decline may start earlier-than-normal because U.S. refinery utilization is ramping up faster and earlier than usual, thereby requiring more crude oil.
Check back to see my next post!
Best,
Robert Boslego
INO.com Contributor - Energies
Disclosure: This contributor does not own any stocks mentioned in this article. This article is the opinion of the contributor themselves. The above is a matter of opinion provided for general information purposes only and is not intended as investment advice. This contributor is not receiving compensation (other than from INO.com) for their opinion.
I really appreciate the true picture of oil. may God bless you.
REGARDS
thank you, shahid.