
The price of crude oil closed above the earlier top of $54.6 last Friday to confirm the reversal to the upside. So, is it the right time to find out how far we can go with it?
At the end of last May, I posted an early warning of the imminent crash of crude oil price amid the mass media euphoria from the dream of the $100 price tag per barrel, which was a good contrarian indicator. The price of WTI finally dropped last October after it broke long-term support.
I am very grateful to you as you were very active on the poll where I asked you to share your expectations about the crude oil price by the end of 2018. Below are the results of it.
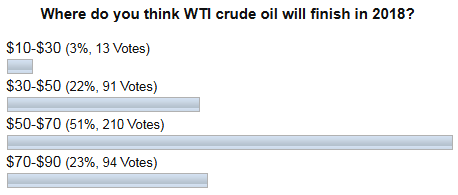
As we can see most of you were ready for the drop of the oil price in the next lower range between $50 and $70 marks, although there were oil optimists in second place, who bet on the price to be in the $70-$90 range. Only those whose bets ranked the third ($30-$50) turned out to be right as oil finished the previous year at $45.8 after hitting the $42 area the day before Christmas.
In this post, I would like to show you some historical similarities, which could help us to understand how deeply the current pullback could go. Let’s start with the bigger chart.
Chart 1. WTI Crude Oil Futures Weekly: Selecting Similarities
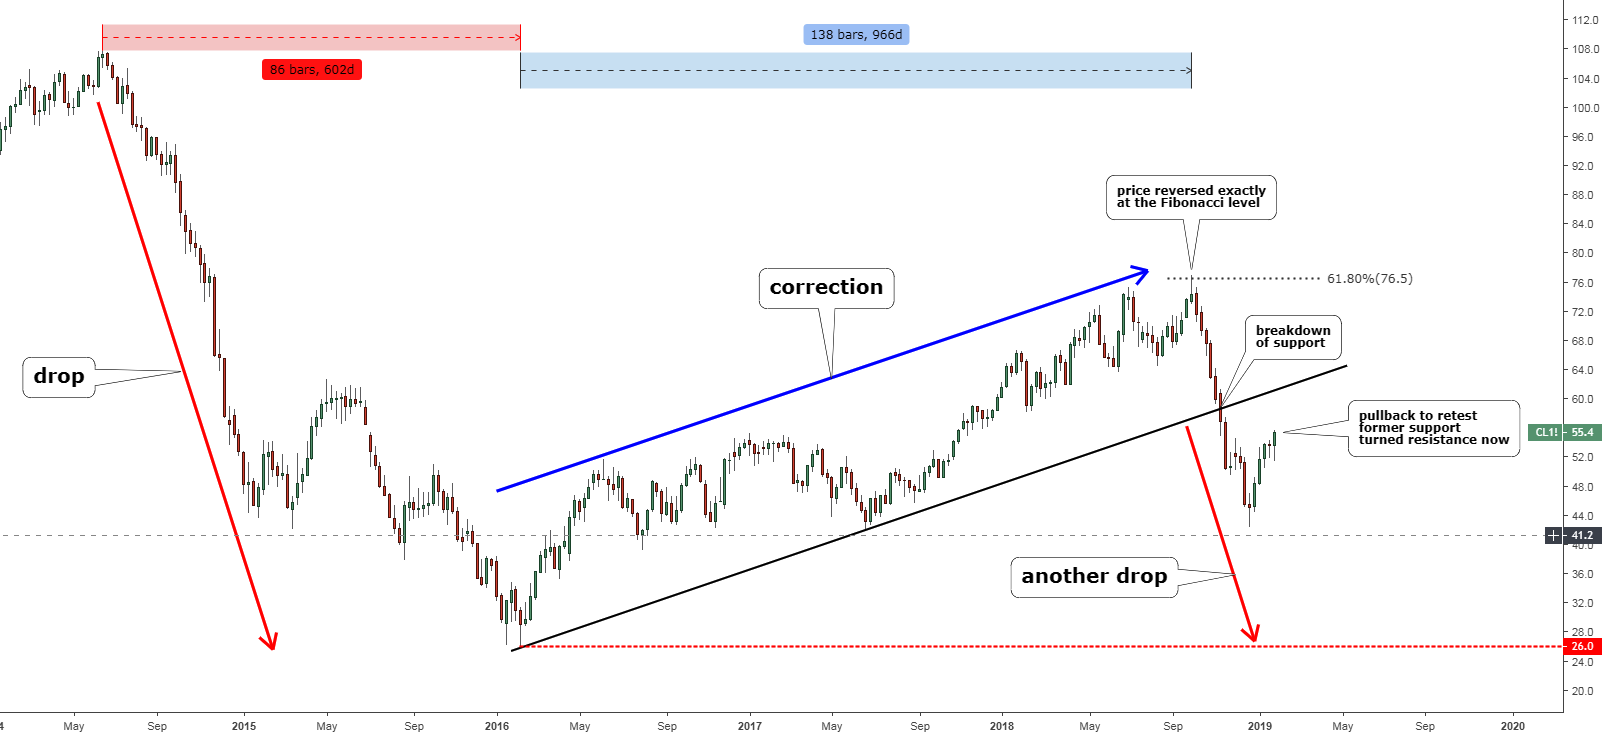
Chart courtesy of tradingview.com
In the chart above, we can see how two market stages change each other one by one. From left to right – firstly we had a considerable drop from the $100+ area (left red down arrow); it was a quick sharp-angled move, and it took 86 weeks to unfold. Next was the large corrective structure (blue up arrow), which was examined in details last year. So, the following drop wasn’t a surprise for those who know market stages or read my blogs.
The corrective phase was quite long, but it is a natural process, it took 138 weeks to emerge (1.61 times longer than the preceding drop). I want to bring your attention to the depth of the correction – it reached right the magic Fibonacci retracement level of 61.8% at the $76.5 and right there the reversal had started.
Other classical attributes of the market price action are the breakouts and pullbacks. In the chart above, we can see how the breakdown was followed by a pullback, which is streaming to retest the broken former support, which acts as resistance now.
Now let us apply this historical market structure to the current situation on the shorter time frame.
Chart 2. WTI Crude Oil Futures Daily: From Big To Small

Chart courtesy of tradingview.com
This is a daily chart above, which starts with October 2018 drop. On 24th of December 2018, we entered the consolidation stage as short covering emerged amid profit-taking. I applied three elements of the 1st weekly chart above to the daily chart. The first thing is the clone of the 2016-2018 correction bars pattern, which was resized to fit with the short term period (blue bars). It started well so far, although the current price development looks sharper and crude oil is stronger this time.
The second instrument is the proportion of the time periods, which were spent during the huge drop (86 bars) and the following correction (138 bars). It equals 1.61, and we know that it is not just numbers. There is a Fibonacci ratio of 1.618. So, I took this magic proportion and calculated the ongoing correction period multiplying it to 57 bars (red) of the preceding drop. The answer is 92 bars (blue), and therefore the end of consolidation falls on the 6th of May, 2019 (blue vertical line).
And the last element is a 61.8% Fibonacci retracement level, which stopped the large correction on the weekly chart. It is located at $63.7.
Now, we have time and price targets for the current correction and even the trajectory of the price move to be watched. The latter shows that soon the market could start an intermediate consolidation within a $49-$56 range, which historically took place between June 2016 and June 2017 on the first weekly chart. In March the market is expected to resume its upside move to complete the entire corrective structure.
Intelligent trades!
Aibek Burabayev
INO.com Contributor, Metals
Disclosure: This contributor has no positions in any stocks mentioned in this article. This article is the opinion of the contributor themselves. The above is a matter of opinion provided for general information purposes only and is not intended as investment advice. This contributor is not receiving compensation (other than from INO.com) for their opinion.
Crude oil is on a "no stop" increase supply side curve with the US adding enough new supply to offset any disruptions from other global producers. There is an artificial ceiling and a lower barrier that should put oil trading in a range of no lower than $42.50 to a high of no higher than $82.50 per WTI barrel. The low side is a floor based upon sheer economics of break even for most US shale plays and the inability of capital support for advanced or ongoing exploration at trading terms sub $50 a barrel. It would take six moths but the capital spicket would be turned off or trimmed back resulting in a 12-18 month recovery of crude oil prices as drilling slows and decline curves drop supplies. The high side factors in political pressure for the "consumer" and with alternatives viable above $100 a barrel equivalent, it means the oil and gas industry has a tight window of upside before a tremendous amount of pressure pushes oil prices back down,. Political pressure, consumer resistance and of course cost the increasing cost of capital as global capital becomes more expensive. WTI five year average $72.50 a barrel.
I opted option "None" because movement of crude is something different then any other commodity so from now, with in a full year, i.e. up-to 31-December, for crude ( Last Close $ 54.84 ) we may find wide range like $ 45 to $ 65 or $ 40 to $ 70, and also such move will be faster and immediate too. However, as per my view, overall bear run can be expected.
oversupply and weak foreign economies will keep oil between $ 40-50 range.