
I’ve had a bearish outlook for copper for the past 2 years, starting with my post back in September 2017 when I had doubted the metal’s ability to sustain a long-term rally. Last July, we got the final confirmation of the trend reversal to the downside. And this past February I shared with you a promising trading opportunity, which had appeared in the copper market as the short-term upward correction invited the bears to sell the copper again around $3.
Indeed, copper has plummeted since then reaching the $2.48 low at the start of this month, but the following rapid bounce into the $2.70 area signaled a possible reversal ahead.
Let’s check the charts below to see if we can find some clues behind this worrisome price action.
I start with the weekly chart as I spotted a bullish pattern there already.
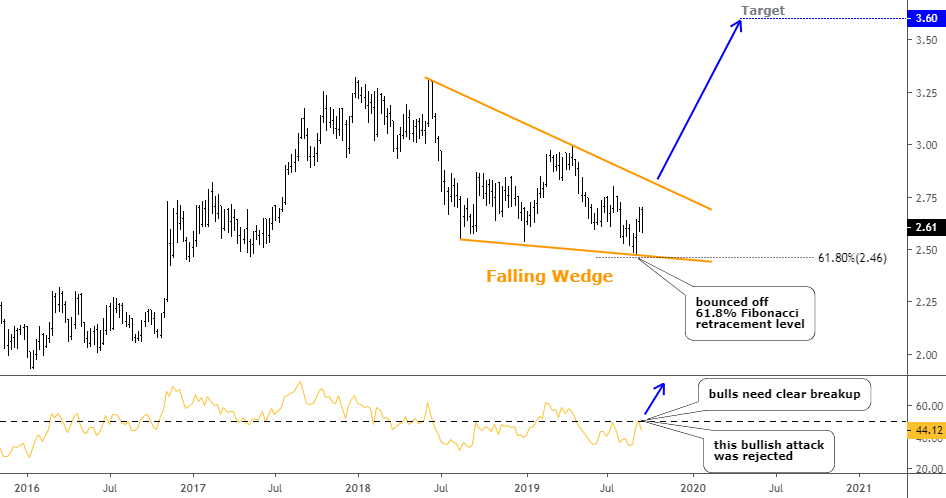
Chart courtesy of tradingview.com
As I said above the price printed the low of $2.48 and quickly reversed then. I added the Fibonacci retracement level of 61.8% to the chart, and you can see now that the price bounced right off it. In my February post, I applied AB/CD segments to set the target area for an anticipated drop and even used the extension ratio, where the CD is even larger than the AB segment.
It appeared that the CD segment of the last drop was way shorter than the AB segment. I didn’t add it here to stay focused on the pattern I detected. It turned out that the CD segment could only reach the 61.8% level of the AB segment’s distance. This time it also coincided with the same ratio of Fibonacci retracement as we got 61.8% twice in different measurements - another proof of mathematical magic.
Let’s get back to the promised pattern. The metal’s weakness since 2018 could have shaped the Falling Wedge continuation pattern (orange) on the chart. This pattern could bring the copper price beyond the former top of $3.32 up into the $3.60 area. The bulls should break up the trendline resistance around the $2.83 level to validate the pattern. The target is located at the distance of the Wedge’s height added to the breakout point.
The RSI has already attempted to break above the crucial 50 level, but it was rejected. Bulls need a clear breakup to build the upward momentum.
As time goes by, I turned to a bigger time frame for more clues as we should aware of the global price position, especially when we see the reversal patterns on a shorter time frame.
Let’s look at the quarterly chart below.
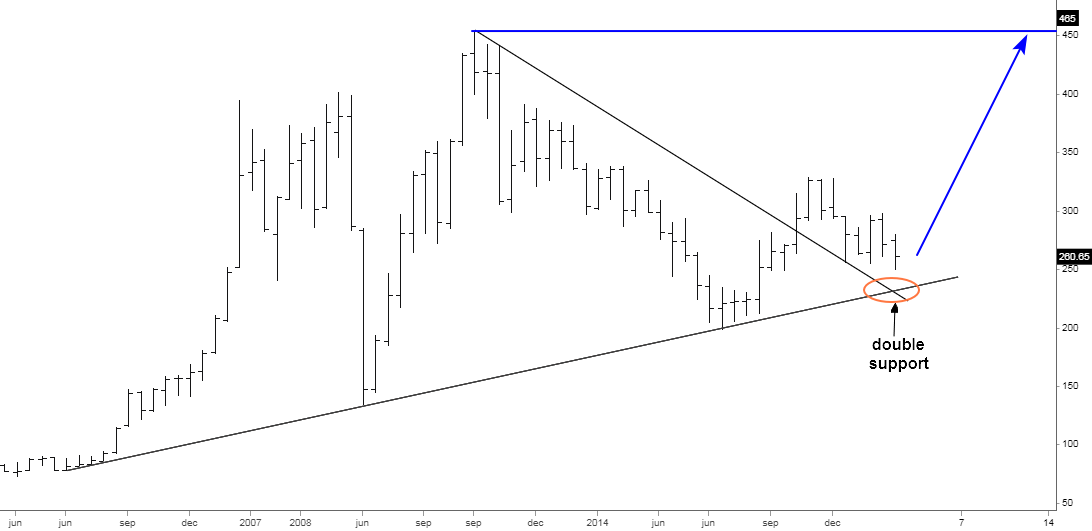
Chart courtesy of stooq.com
This long term chart shows the breakout to the upside in September 2017, that very month when I turned bearish on the metal’s price. So, I was right on the direction, but I was wrong with the structure as I thought we were going to retest the low of $1.94 again within another drop.
This move down is just a correction as the price is making a pullback to the broken trendline resistance. There is also trendline support that underpins the price. It was built through 3 contact points of the valleys of 2002, 2008 and 2016. It looks solid to reject the current drop as it intersects with the trendline resistance in the $2.35-$2.40 area to become double support now.
If this correction will be simple and the price would rocket soon, then we could expect it to retest the top of 2011 at the $4.65. It’s quite ambitious!
What could drive the copper price so high? I found one interesting chart for you below.
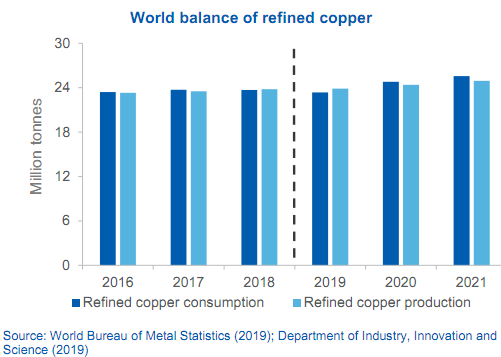
It shows the projections of the world balance of refined copper. This year the production is going to cover the consumption, but demand will outweigh the supply starting next year. Indeed, the foreseeable shortage of copper could lift the price higher.
These days the trade war and the cooling economy hammer the copper price. The politicians come and go, but life still goes its way. Emerging countries expand and invest in infrastructure as India could catch up with China as a top copper consuming nation in 5 years; aging US infrastructure also requires investments, electric cars and green economy, digitization and human progress drive demand either to name the most viable factors.
Intelligent trades!
Aibek Burabayev
INO.com Contributor, Metals
Disclosure: This contributor has no positions in any stocks mentioned in this article. This article is the opinion of the contributor themselves. The above is a matter of opinion provided for general information purposes only and is not intended as investment advice. This contributor is not receiving compensation (other than from INO.com) for their opinion.
I am so excited
Are there any numbers coming out that indicate a fundamental reason at this time for copper to go up? Charts under normal conditions can be informative, but there are so many lies out there that the charts are becoming unreliable. How many out there have been noticing failed chart patterns? When the futures market can no longer control prices, look out.
The main reason to look for a bottom and rally in copper is the recent rally in gold - gold always leads copper (the lead time varies, but copper invariably follows gold higher).