
Many years ago, when I was fifteen, I was inspired to become a professional trader after I had read a magazine story about a so-called “whale, the large market player. He was moving the markets with large orders sent to his broker out of his luxury hotel room. Markets were panicking, and politicians were trying to soothe the public telling them “true” stories. But the truth is that the impulse of the price was generated first in the “whale’s” mind and then it reached the market through the skillful hands of his broker, no other reason, except his will. The concept behind his action is a real mystery, known solely by himself. He could use any kind of analysis to be successful. The remaining is just the “noise.”
We are not “whales,” and I am not fifteen anymore, but we can find market irregularities to turn it into a profit. Let politicians talk, media buzz and profit run.
The bitcoin structure has been developing prophetically accurate as per the plan, that I shared with you a month ago. The leading coin has dropped hard from what looked to be an unbreakable area at $10,000 to hit the most anticipated target of $7,800. The actual low was just a few dollars below it. Again, the majority of you have made the correct choice based on the chart structure I highlighted for you. Hopefully, our vision gets sharper over time.
This collapse extended the damage of the crypto to 43% from the top of $13,764 established in June. The media have naturally started the “noise,” but we were prepared for this move two months ago, and we are not going to buy their “truth” as they usually sell extremes of either doomsday or a tulip mania. None of this is going to happen soon. Some “whales” just pushed down the market reckoning old trading wisdom – “if they don’t buy then I sell.” That’s it. This is what I was telling you at the opening of this post.
The big picture that I shared with you this July has not been changed. Let’s have a look at the daily chart below to see if we can find new clues for the next move.
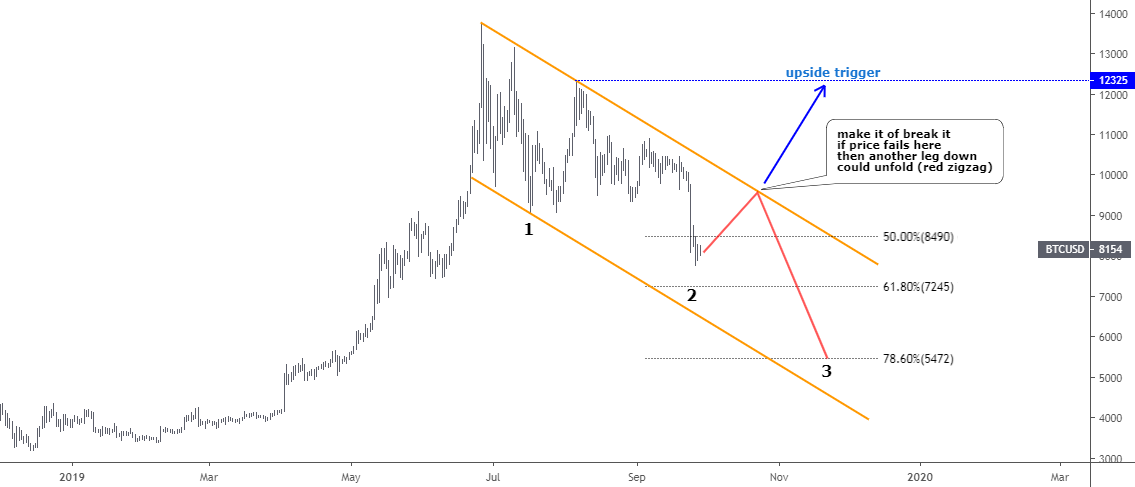
Chart courtesy of tradingview.com
The price of bitcoin pulled back quite deeply as it reached between 50 and 61.8% Fibonacci retracement levels. The leg no #2 is equal to leg #1. It means that the correction’s structure has already met the regular standards and price could reverse to the upside at any time. I contoured it with an orange trend channel. We should watch the breakout of this channel to have the initial confirmation of the complete correction. The crucial level is located around the psychologically important $10k mark.
There is a risk of a third leg down to unfold if the price would fail at the resistance. We can’t rule it out as it could bring more damage to a bitcoin sending it down to the next 78.6% Fibonacci level at the $5,472.
The upside trigger is still there safe at the top of the leg #2 at the $12,325.
Intelligent trades!
Aibek Burabayev
INO.com Contributor, Metals
Disclosure: This contributor has no positions in any stocks mentioned in this article. This article is the opinion of the contributor themselves. The above is a matter of opinion provided for general information purposes only and is not intended as investment advice. This contributor is not receiving compensation (other than from INO.com) for their opinion.