
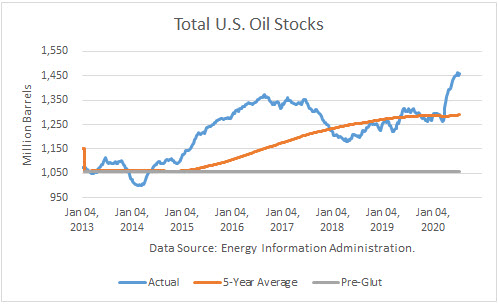
According to the Energy Information Administration, U.S. petroleum inventories (excluding SPR) built by 8.8 million barrels last week to 1.461 billion, whereas SPR stocks were unchanged. Total stocks stand 171 mmb above the rising, rolling 5-year average and about 157 mmb higher than a year ago. Comparing total inventories to the pre-glut average (end-2014), stocks are 402 mmb above that average.
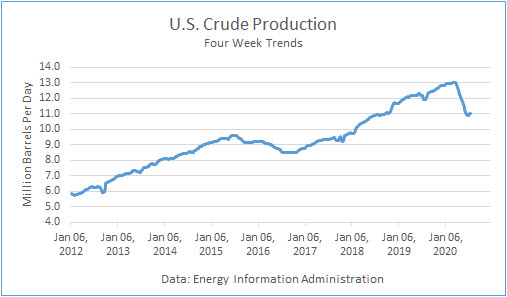
Crude Production
Production averaged 11.1 mmbd last week, up 100,000 b/d from the prior week, and 11.025 mmbd over the past 4 weeks, off 7.7 % v. a year ago. In the year-to-date, crude production averaged 12.129 mmbd, up 0.4 % v. last year, about 50,000 barrels per day higher than a year ago.
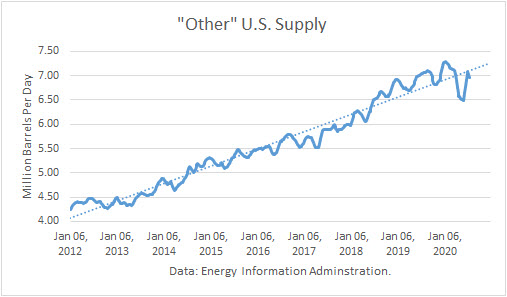
Other Supply
I have previously noted how the "Other Supply," primarily natural gas liquids and renewables, are integral to petroleum supply. The EIA reported that it fell by 30,000 b/d v. last week at 6.789 mmbd. The 4-week trend in "Other Supply" averaged 6.958 mmbd, off 0.4 % over the same weeks last year. In YTD, they are 0.7 % higher than in 2019.
Crude production plus other supplies averaged 17.983 mmbd over the past 4 weeks, well below the all-time-high record.
Crude Imports
Total crude imports rose by 373,000 b/d last week to average 5.941 mmbd last week. This figure was below the 4-week trend of 6.218 mmbd, which in turn was off 13.5 % from a year ago.
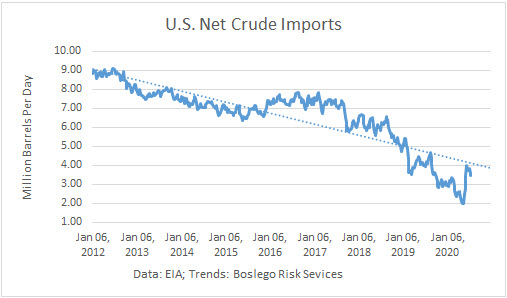
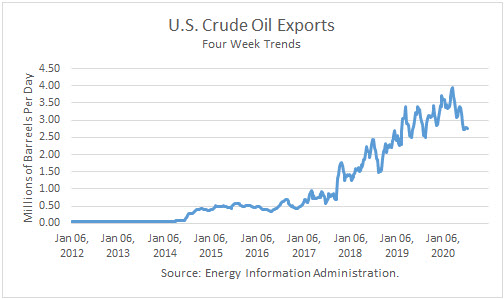
Net crude imports fell by 77,000 b/d because exports rose by 450,000 b/d to average 2.993 mmbd. Over the past 4 weeks, crude exports averaged 2.754 mmbd, 7.2 % lower than a year ago.
U.S. crude imports from Saudi Arabia fell by 412,000 last week, to average 461,000 b/d. The surge in Saudi exports to the U.S., which began in late March after the price between the Saudis and Russians, has fallen off. Over the past 4 weeks, Saudi imports have averaged 895,000 b/d, up 72 % from a year ago.
Getting started is easy! Test our tools with a 30-Day Trial.
Crude imports from Canada rose by 184,000 b/d last week, averaging 3.354 mmbd. Imports over the past 4 weeks averaged 3.149 mmbd, off 15.2 % v. a year ago.
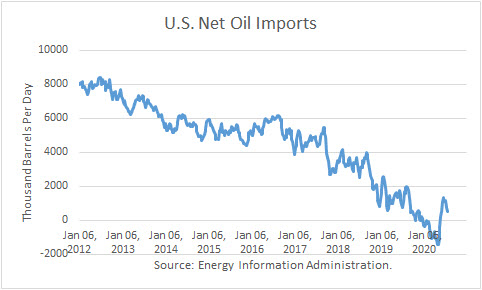
Net oil imports averaged 498,000 b/d over the past 4 weeks. That compares to net oil imports of 1.701 mmb/d over the same weeks last year. This is the eighth 4-week period this year that imports exceeded exports.
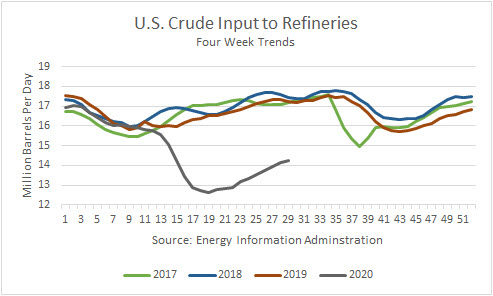
Crude Inputs to Refineries
Inputs fell by 103,000 b/d last week last week averaging 14.206 mmbd. Over the past 4 weeks, crude averaged 14.224 mmbd, off 17.6 % v. a year ago. In the year-to-date, inputs averaged 14.518 mmbd, off 12.5 % v. a year ago.
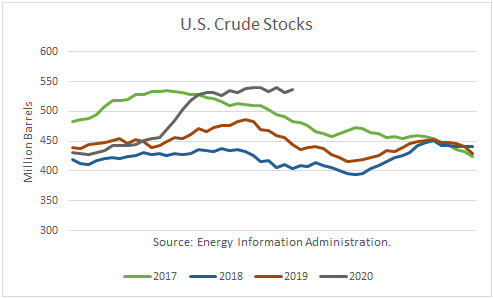
Crude Stocks
Over the past 4 weeks, crude oil demand exceeded supply by 61,000 b/d.
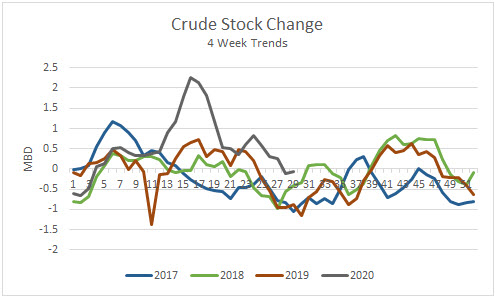
Commercial crude stocks 536.6 mmb are now 91.5 million barrels higher than a year ago.
Petroleum Products
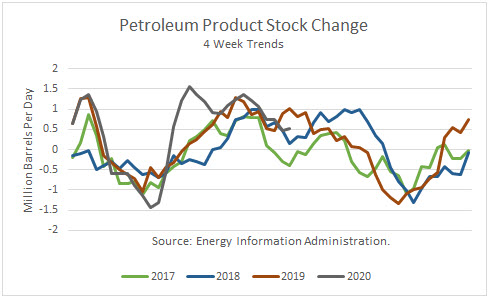
Given the recent net product stock builds, product supply has exceeded demand by 523,000 b/d.
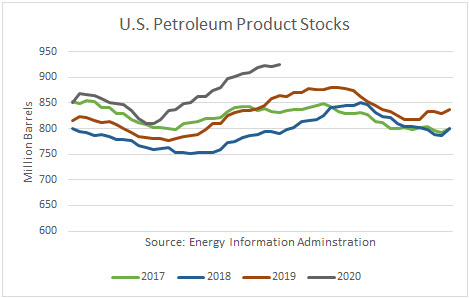
Total U.S. petroleum product stocks at 925 mmb are 65 million barrels higher than a year ago.
Product exports rose by 68,000 b/d last week, averaging 4.900 mmbd. The 4-week trend of 4.923 mmbd is up 1.2 % from a year ago. In the year-to-date, exports averaged 5.087 mmbd, up 0.5 % from a year ago.
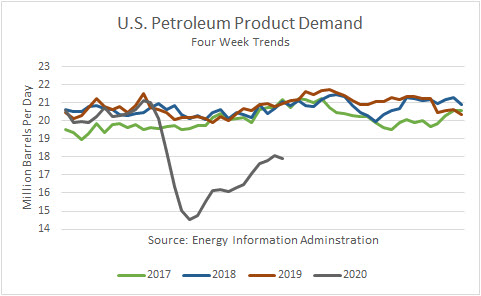
Demand
Total petroleum demand averaged 17.902 over the past 4 weeks, off 14.6 % v. last year. In the YTD, product demand averaged 18.082 mmbd, off 12.2 % v. the same period in 2019.
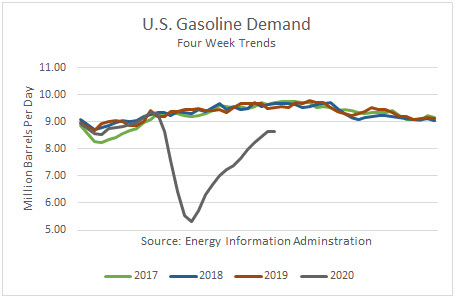
Gasoline demand at the primary stock level fell by 98,000 b/d last week and averaged 8.631 mmbd over the past 4 weeks, off 9.5 % v. the same weeks last year. In the YTD, it reported that gas demand is off 15.1 % v. a year ago.
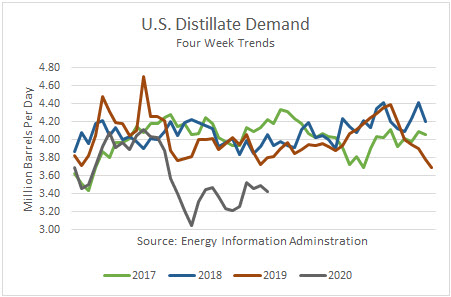
Distillate fuel demand, which includes diesel fuel and heating oil, rose by 470,000 b/d last week, and averaged 3.428 mmbd over the past 4 weeks, off 9.8 % the same weeks last year. In the YTD, demand is off 10.7 % v. a year ago.
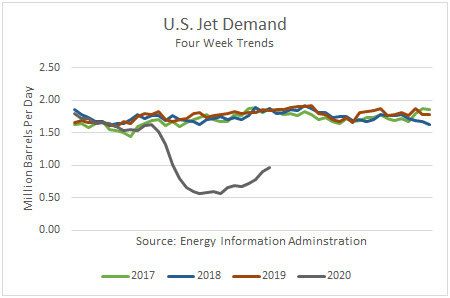
Jet fuel demand is off 47.7 % over the past 4 weeks v. last year. In the year-to-date, demand was off 37.6 % v. 2019.
Product Stocks
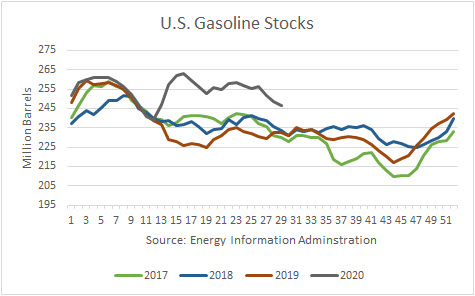
Gasoline stocks are now 14.2 mmb higher than a year ago, ending at 246.7 mmb.
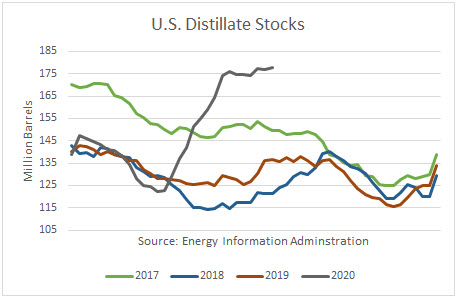
Distillate stocks are 41.1 mmb higher than a year ago, ending at 177.9 mmb.
Conclusions
Crude oil stocks led total stocks higher this week, instead of lower, as expected. Despite a recovery in crude oil and product demand, this week's stats are proof that the inventory glut is going to be difficult and time-consuming to erase.
The White House has admitted that the pandemic may get worse before it gets better. And so the recovery in oil demand may have stalled. Congress is preparing another stimulus package to try to keep the economy from sinking. So it looks like this is going to be a prolonged affair until proven effective therapeutics and/or a vaccine allows work and school to return to their pre-pandemic levels.
Check back to see my next post!
Best,
Robert Boslego
INO.com Contributor - Energies
Disclosure: This contributor does not own any stocks mentioned in this article. This article is the opinion of the contributor themselves. The above is a matter of opinion provided for general information purposes only and is not intended as investment advice. This contributor is not receiving compensation (other than from INO.com) for their opinion.