
Almost all targets, which were set in the previous post, were reached last week except for the gold. I think the central banks bought the dip of the gold price, as the silver was lack of such strong support.
The majority of readers guessed it right as the US dollar index (DXY), aka “The King,” exceeded the target and reached the trendline resistance that I have mentioned at the beginning of the month. It is time for updates, and “The King” will open the series of charts.
The DXY daily chart is the first.
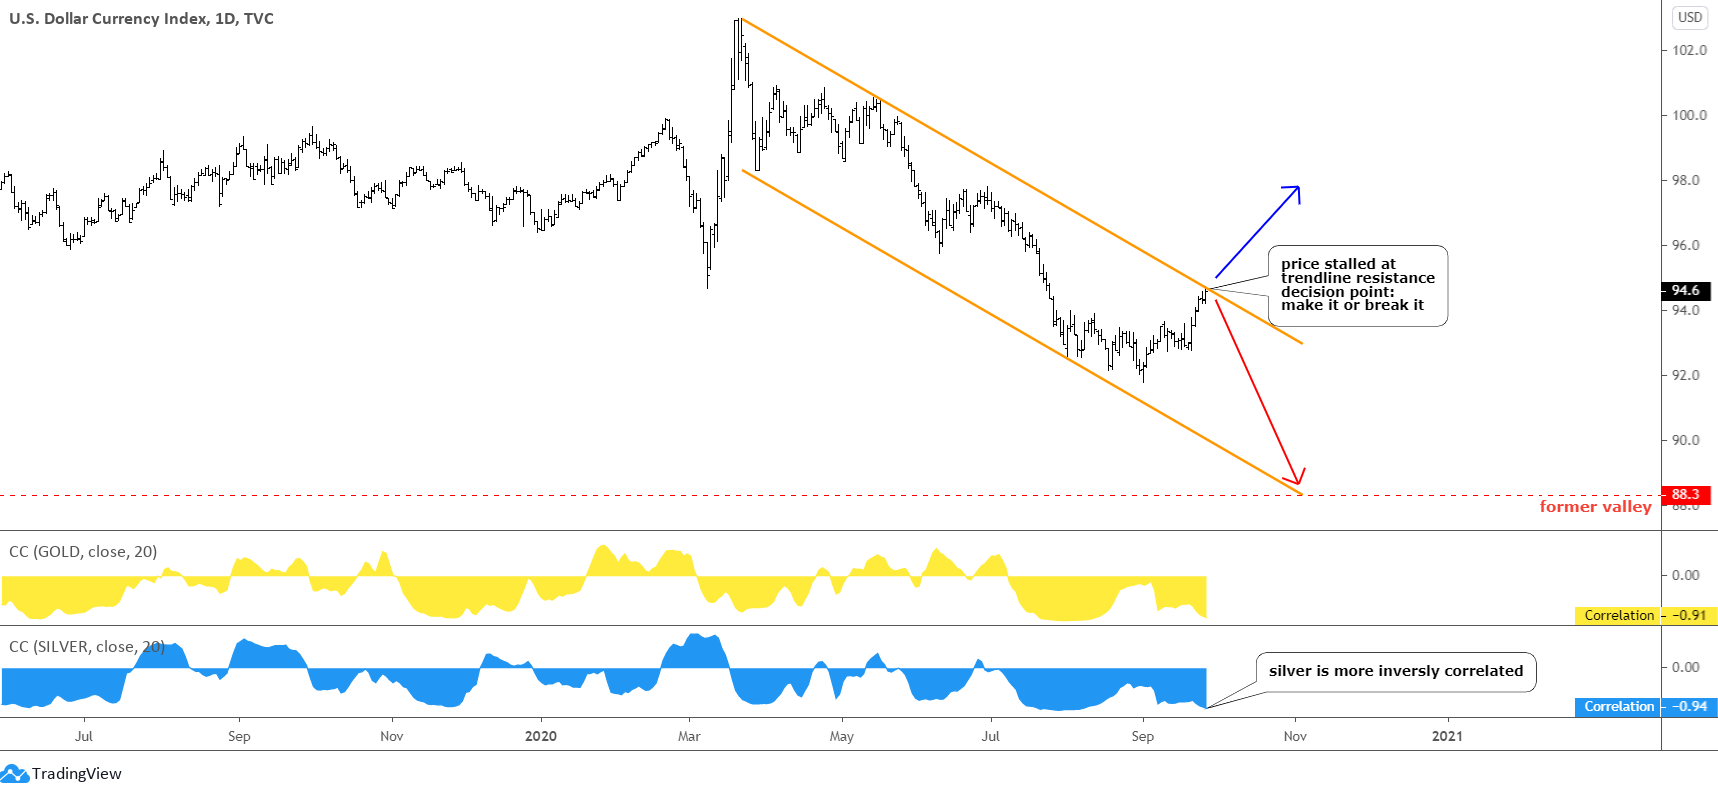
It is interesting to see how from time to time, the market catches traders in a “make it or break it” situation right at the end of the trading week, keeping their heads spinning with almost paranoiac thoughts – “I should keep the profitable position Vs. I should book the profit”. It is even worse this time as usually Friday is the “book the profit and relax” day, but the price just stalled on the trendline resistance; hence not much of the selling to cover was there.
This time it could be a pure guess of what will happen to the dollar next as the price reached both the upside target and the trendline resistance. In case we see a reversal, I set the aim for it in the former valley of 88.3, which was established more than two years ago in 2018. The upside target in case of a breakup will be set in upcoming posts once we see a pullback as we should get the new C point of another CD segment.
I added two sub-charts with a Correlation indicator for gold (yellow) and silver (blue). You can see that the conventional negative correlation between DXY and precious metals was growing since the start of the first leg up on the dollar index chart, and it reached the peak last week. Silver was more inversely correlated as its reading was at -0.94, and gold was not hit as bad as it stalled at -0.91. Anyway, it was very close to the absolute mirrored correlation. However, this is just one of those periods of such strong correlation. We can also observe the periods of independence or even a positive correlation from time to time on the same sub-charts.
The following monthly chart of DXY could shed more light on the fate of the dollar index.
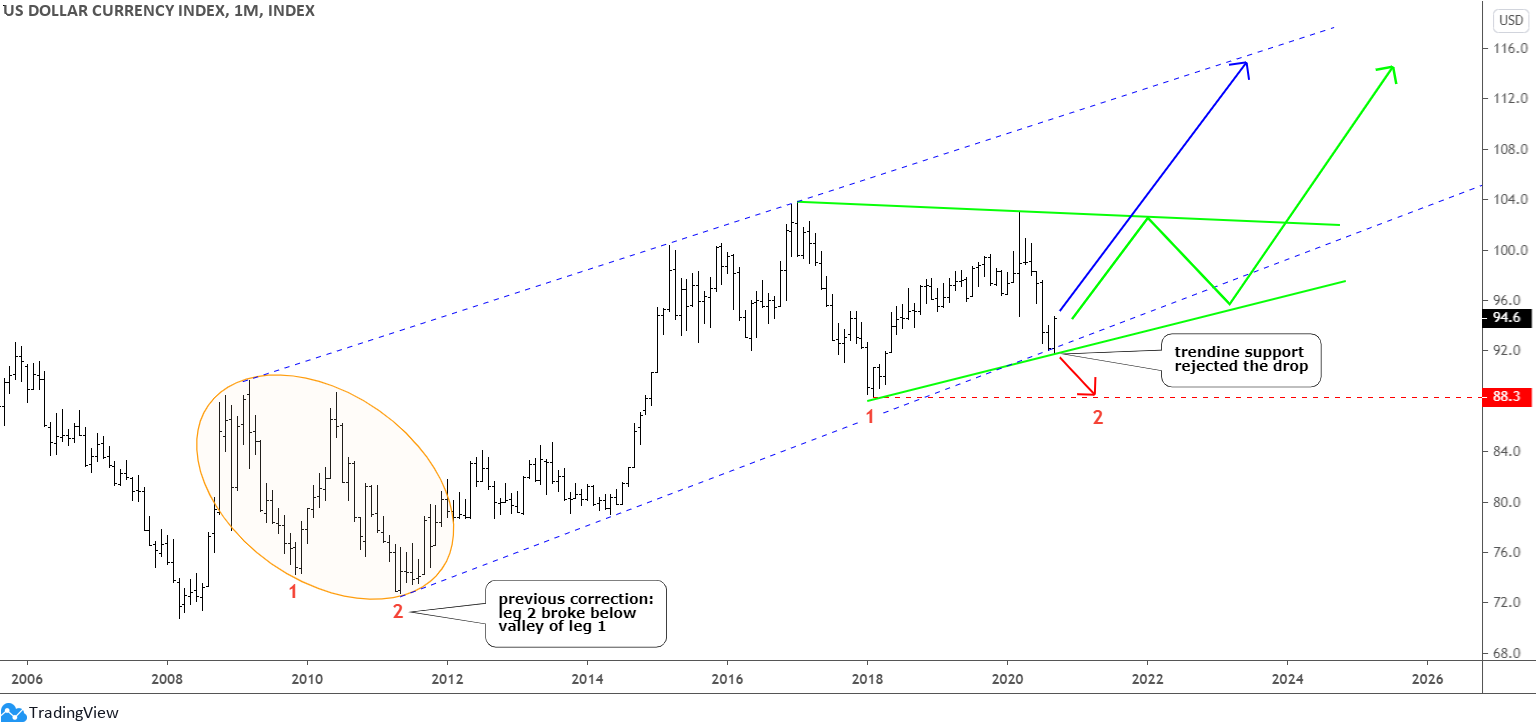
On the big map, we are in the possible second leg of a sideways consolidation within the blue uptrend. The price bounced off the blue trendline support. It is actually double support as on the first daily chart, and it was minor support.
The price of the dollar has dropped hard since the outbreak of pandemics, but this did not change the entire bullish structure so far as the index is just consolidating within a large range between 103.8 and 88.3. I put three possible scenarios that we could see to emerge.
The red down arrow shows the shortest path that is already in the making as it implies just the completion of the classic sideways consolidation with the second leg down tagging the valley of the first leg at 88.3. The red arrow path of the first daily chart above is showing that path as well.
The bullish blue up arrow path could develop if the consolidation was already completed with a truncated leg two down. The upside of the trend channel helps us to set the ambitious target of 115 for DXY. If the mirrored correlation with precious metals persists, then the former could be in trouble with this scenario, as it could activate the huge complex correction that I showed you this March for gold.
The green annotations highlight the possible extended triangular consolidation as we got enough extreme points to build that geometric shape. This path could build the same, but inversed extended consolidation on the precious metals charts.
Now, let us move on to precious metals, and gold’s daily chart is the next.

Gold reached only the minimum target of $1863 that I set in the last post as the price has hit the valley of the first leg down and stalled there, finding strong demand there. The foreseen second wave of pandemics, the uncertainty of the upcoming presidential election in the United States, and the simple biased adding to the bullish position of central banks support the price.
In my opinion, the consolidation still looks incomplete, and the intermediate consolidation between the first and the second leg down could still be underway. This scenario was brought to you within a red path at the beginning of this month. The price of gold should revisit the earlier top of $2016 and then collapse again to $1800 level. It is a wide range of more than $150 up and then more than $200 down.
The blue arrow shows the path, and we already completed the correction after all. Both paths show the instant rise of gold in the $2000 area before they diverge. It reflects the scenario of a reversal (red down arrow) on the daily DXY chart above.
The silver’s daily chart finishes the update.
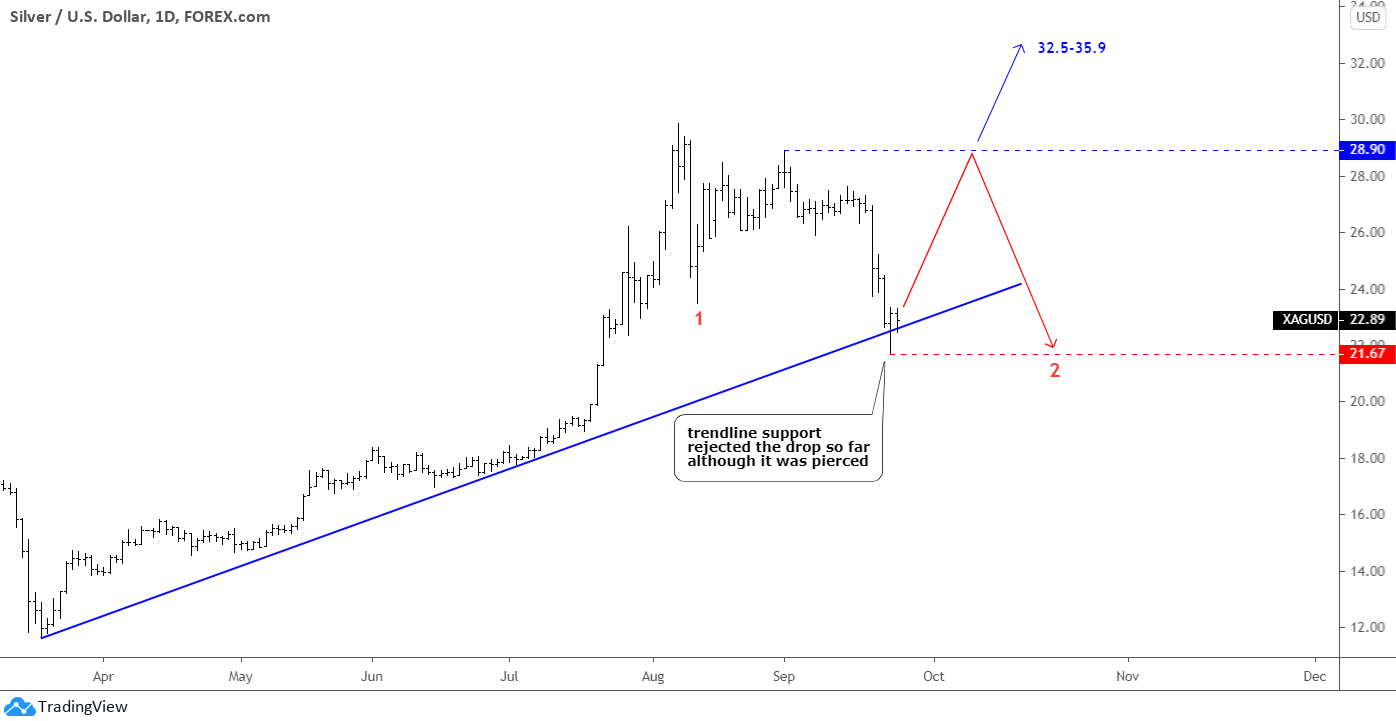
Silver was your favorite all the way, but it was hit hardest this time as it dropped much below the initial target of $22.50, losing more than 27% from the top. This is common but still crazy volatility as this instrument lacks liquidity compared to gold.
The blue trendline support rejected the drop, although it was punctured, the following market close was even higher than the open last Thursday. The metal’s consolidation looks like it was completed, but I cannot avoid adding here gold’s red path of the complex consolidation first. It implies the retest of the monthly high at $28.9 to finish the intermediate consolidation between two legs down. Then the second leg could start to tag the recent bottom of $21.67.
The blue arrow shows the scenario of rapid growth to the earlier set targets between 32.5 and 35.9, considering the completion of consolidation.
Intelligent trades!
Aibek Burabayev
INO.com Contributor, Metals
Disclosure: This contributor has no positions in any stocks mentioned in this article. This article is the opinion of the contributor themselves. The above is a matter of opinion provided for general information purposes only and is not intended as investment advice. This contributor is not receiving compensation (other than from INO.com) for their opinion.