
This week we have a stock market forecast for the week of 10/10/21 from our friend Bo Yoder of the Market Forecasting Academy. Be sure to leave a comment and let us know what you think!
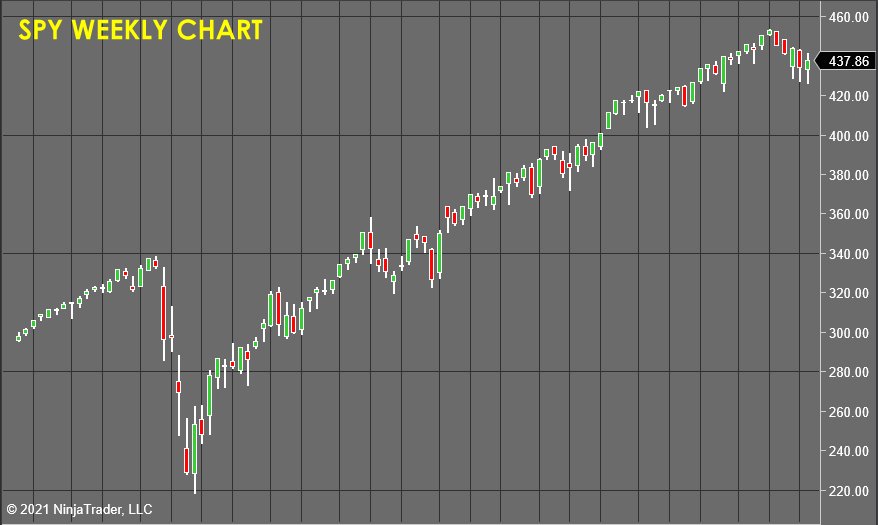
The S&P 500 (SPY)
My life got medically hijacked a few weeks ago when our daughter decided to make her appearance a few weeks early! We spent some time with her in hospital, but all is well that ends well, and she's happy, healthy, and home!
It's times like these that really make me grateful that I have been blessed to live the life of an independent trader, free to dodge and weave and adapt to the curve balls life throws at you.
I haven't looked at screens for a while, so I come to the charts with fresh eyes. Here is what I'm seeing and can forecast for the week to come.
All my readings for the S&P 500 are bearish, yet a surge of bullish interest will need to get absorbed and rejected before the bears can dominate the trend.
I would expect the SPY to rally up to retest the all-time highs and break out to the upside. Unfortunately, that breakout would likely be on low momentum, and the odds are high. Thus, it will turn into a false breakout. This would set up a classic "Trap trade," as the breakout players all react emotionally to the failed breakout.
I'll be focused on the long side intraday early next week, then once the breakout gets rejected will flip to the bear side and try to surf the emotional selling down for some nice short intraday trades.
Caterpillar Inc. (CAT)
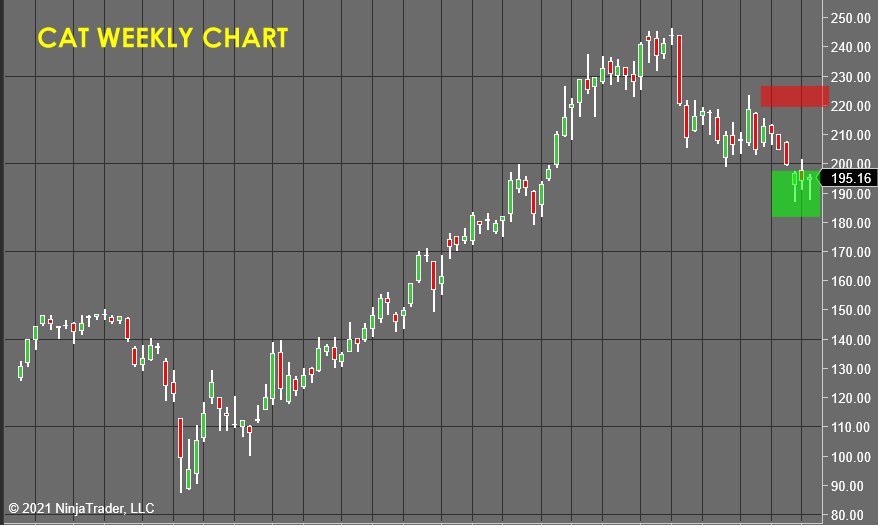
CAT has been in a deep correction for months. Over the last 3 weeks, the price has been tested and rejected bullishly at the $185 area twice. The candle printed in last week's trading is a "Trigger event," which should attract an increasingly aggressive group of bulls as they react to a cascade of different bullish trading setups that are likely to form.
I would see this stock as attractive for long exposure anywhere in the green zone, with a profit expectation above the $220 per share area.
Vulcan Materials Company (VMC)
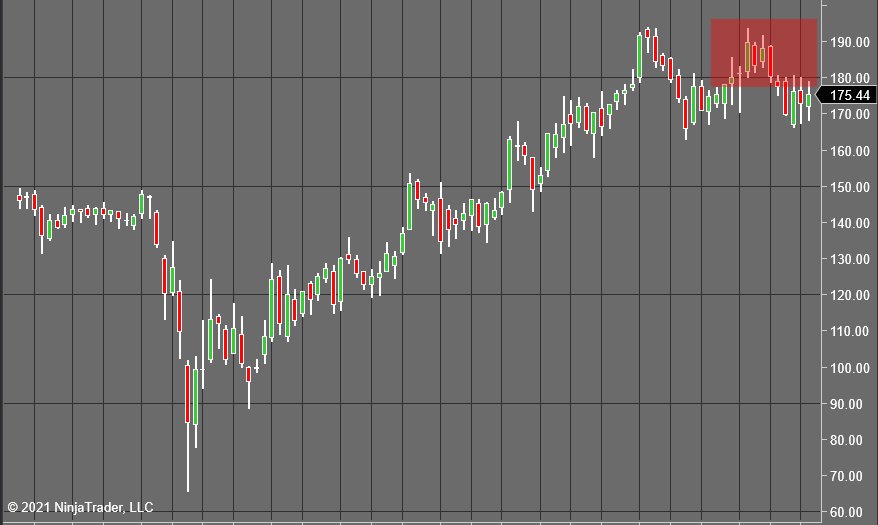
VMC has spent the time I was away from my screens going precisely NOWHERE.
This lack of passion from the bears, coupled with a recent surge in hidden bullish orders, leads me to believe this stock will spike up next week along with the markets. Since the price is currently right below entry, it offers a chance to scratch the trade with a little profit before that turns to loss as a rally forms.
SPDR Gold Shares (GLD)
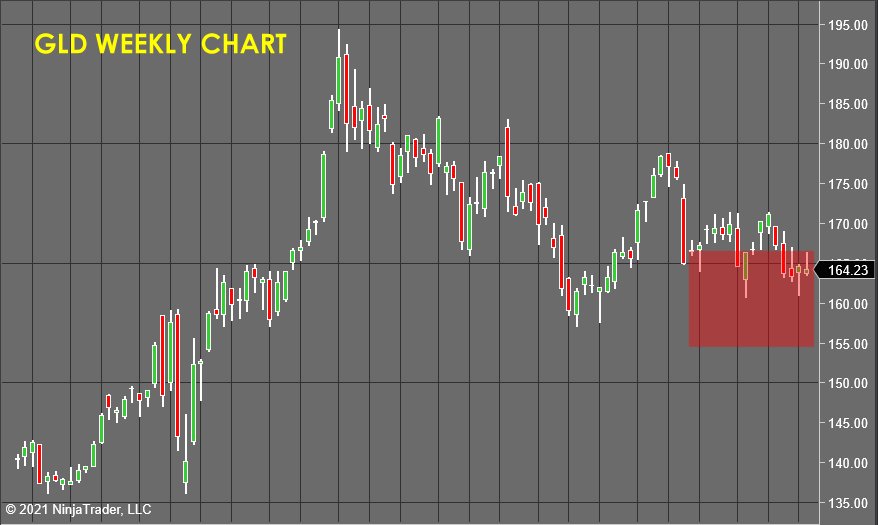
GLD retested the support levels near $160 per share while I was away. It was rejected quickly to form a "Hammer" reversal candlestick. This attracted bullish interest early this week, but then that power weakened, and we were left with an opposing BEARISH "Hammer."
This conflict is confusing... which side will win the battle of the candles?
To get an objective read on the supply/demand forces in the markets and deliver you a mini-lesson for this week, I'll drop down to a daily chart...
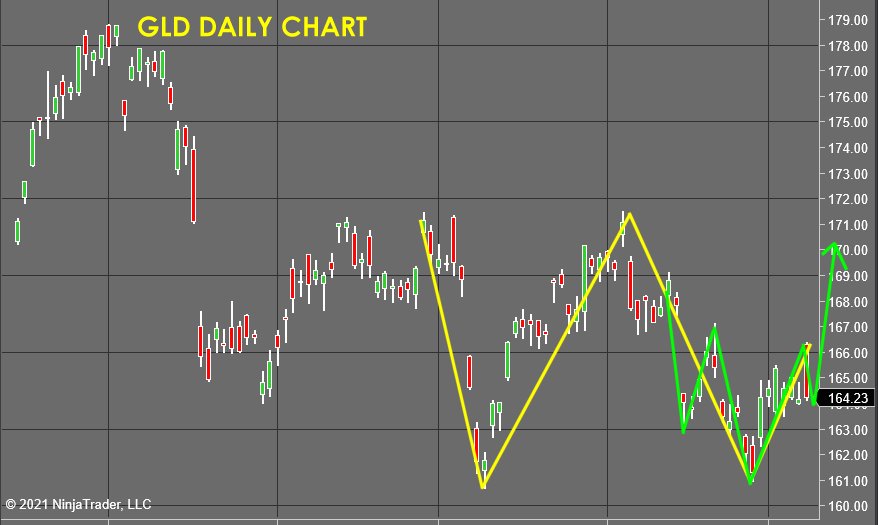
Notice the double test of support near the $161 area to form a "double bottom" reversal pattern? I have highlighted this action in yellow...
Next, notice the "inverted head and shoulders" highlighted in green that may form over the next week if the selling seen on Friday attracts bargain hunters early next week. That would confirm the pattern, and with both these bullish patterns triggering in the same week, you have TWO big bullish "clubs" who are likely to be active in this market.
With both forces in alignment, I have a data-centered and OBJECTIVE reason to believe that the odds are stacked to the bull side; therefore, I am taking corrective action to maintain my long exposure in that stock.
Chuck Palahniuk once said...
"What we call chaos is just patterns we haven't recognized. What we call random are just patterns we can't decipher. What we can't understand we call nonsense. What we can't read we call gibberish."
Hopefully, this example shows a peek into my mindset and how I go about seeking data, measurements, and patterns that will guide me to a correct forecast.
This process is very much the same as how a weather forecaster uses barometric pressure and radar data to predict the track of a storm. Will they be 100% accurate, NEVER. But they can give you a great deal of accurate and ACTIONABLE info as they determine where the odds are greatest for the storm to go next.
The PNC Financial Services Group, Inc. (PNC)
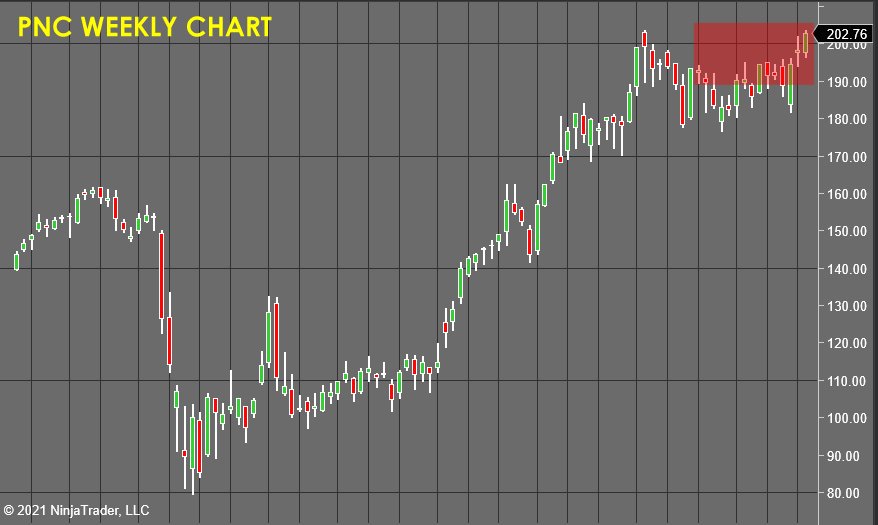
PNC is the casualty from my time spent with my daughter in the hospital. The stock sold off and reversed violently 3 bars back and now is testing for the highs. If it can break out bullishly outside the green zone, it will trigger stop-loss levels and be a failed forecast.
To Learn How To Accurately and Consistently Forecast Market Prices Just Like Me, Using Market Vulnerability Analysis™, visit Market Forecasting Academy for the Free 5 Day Market Forecasting Primer.
Check back to see my next post!
Bo Yoder
Market Forecasting Academy
About Bo Yoder:
Beginning his full-time trading career in 1997, Bo is a professional trader, partner at Market Forecasting Academy, developer of The Myalolipsis Technique, two-time author, and consultant to the financial industry on matters of market analysis and edge optimization.
Bo has been a featured speaker internationally for decades and has developed a reputation for trading live in front of an audience as a real-time example of what it is like to trade for a living.
In addition to his two books for McGraw-Hill, Mastering Futures Trading and Optimize Your Trading Edge (translated into German and Japanese), Bo has written articles published in top publications such as TheStreet.com, Technical Analysis of Stocks & Commodities, Trader's, Active Trader Magazine and Forbes to name a few.
Bo currently spends his time with his wife and son in the great state of Maine, where he trades, researches behavioral economics & neuropsychology, and is an enthusiastic sailboat racer.
He has an MBA from The Boston University School of Management.
Disclosure: This article is the opinion of the contributor themselves. The above is a matter of opinion provided for general information purposes only and is not intended as investment advice. This contributor is not receiving compensation for their opinion.
Your Weekly Forecast for next week begins Monday. Monday's date is 10-11-12.
A new birth and a rare date so close together. A numbers guy like Bo Yoder would chart it as a breakout for sure with great things coming your way.
Great things indeed! Looking forward to the future.