
The Federal Reserve met broad expectations by reducing its interest rate hike to 50 bps this month. However, its emphasis on taming inflation further by raising interest rates in the foreseeable future has dampened the optimism that had kept markets buoyant in the run-up to yesterday’s announcement.
However, in the run-up to year-end festivities, consumer spending is also set to increase, thereby adding more wind to the sails of businesses that have been under pressure by aggressive interest rate hikes and other macroeconomic headwinds for a greater part of the year.
Hence, it could be wise to buy The TJX Companies, Inc. (TJX) and Five Below, Inc. (FIVE) to capitalize on increased consumer spending during the holidays. These stocks show strong trends.
The TJX Companies, Inc. (TJX)
TJX is an off-price apparel and home fashion retailer in the United States and internationally. The company’s operating segments are Marmaxx; HomeGoods; TJX Canada; and TJX International.
TJX’s revenue has exhibited a 6.6% CAGR over the past three years. During the same time horizon, the company’s EBITDA and net income have also grown at 2% and 2.8% CAGRs, respectively.
During the nine months of the fiscal year ended October 29, 2022, TJX’s net sales increased 2.1% year-over-year to $35.42 billion. During the same period, the company’s net income increased 5% and 8.3% year-over-year to $2.46 billion and $2.08, respectively.
Analysts expect TJX’s revenue and EPS for fiscal 2023 to increase 2% and 9.3% year-over-year to $49.51 billion and $3.12, respectively. The company has surpassed consensus EPS estimates in three of the trailing four quarters.
Owing to its strong performance and solid growth prospects, TJX is currently commanding a premium valuation compared to its peers. In terms of forward P/E, TJX is currently trading at 25.41x compared to the industry average of 12.88x. Also, its forward EV/EBITDA multiple of 17.26 is higher than the industry average of 9.15.
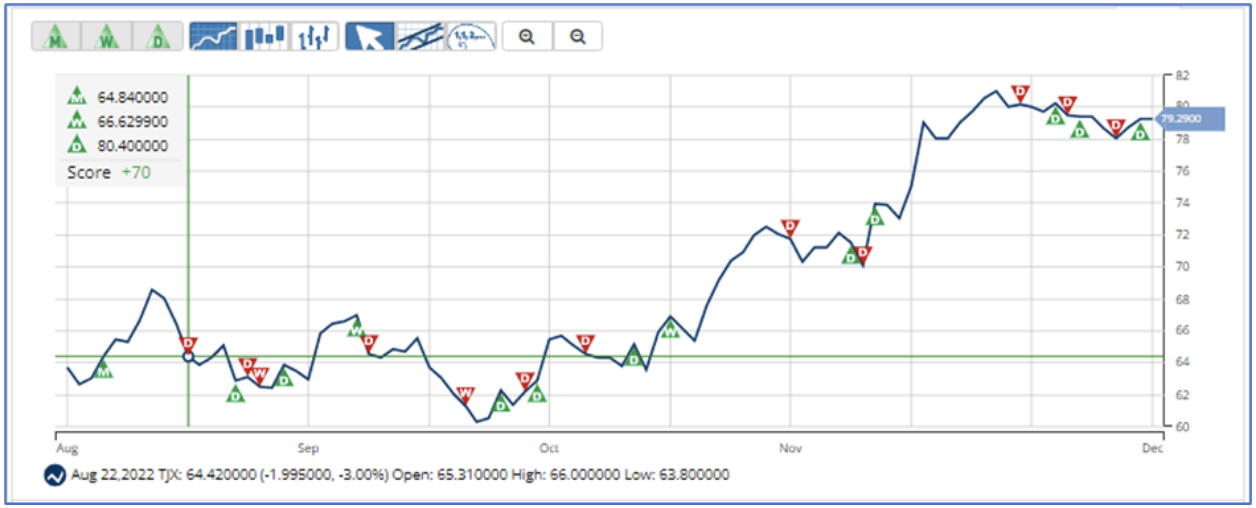
The stock is currently trading above its 50-day and below its 200-day moving averages of $72.88 and $64.52, respectively, indicating an uptrend. It has gained 7.7% over the past month and 38.3% over the past six months to close the last trading session at $79.29.
MarketClub’s Trade Triangles show that TJX has been trending UP for all three-time horizons. Its long-term trend has been UP since August 11, 2022, while its intermediate-term and short-term trends have been UP since October 18 and December 21, respectively.
The Trade Triangles are our proprietary indicators, comprised of weighted factors that include (but are not necessarily limited to) price change, percentage change, moving averages, and new highs/lows. The Trade Triangles point in the direction of short-term, intermediate, and long-term trends, looking for periods of alignment and, therefore, strong swings in price.
In terms of the Chart Analysis Score, another MarketClub proprietary tool, TJX scored +70 on a scale from -100 (strong downtrend) to +100 (strong uptrend), indicating signs of short-term weakness, but it remains in the confines of a long-term uptrend.

The Chart Analysis Score measures trend strength and direction based on five different timing thresholds. This tool takes into account intraday price action, new daily, weekly, and monthly highs and lows, and moving averages.
Click here to see the latest Score and Signals for TJX.
Five Below, Inc. (FIVE)
FIVE operates as a specialty value retailer catering primarily to the young customer segments. The company’s offerings of select brands and licensed merchandise can be grouped into leisure, fashion, home, and party and snack categories.
FIVE’s revenue has exhibited an 18.7% CAGR over the past three years. During the same time horizon, the company’s EBITDA and net income have also grown at 19% and 14.4% CAGRs, respectively.
Due to improving ticket and transaction metrics during the third quarter of the fiscal year 2023, ended October 29, 2022, FIVE’s net sales increased 6.2% year-over-year to $645.03 million, while its gross profit increased 2.7% year-over-year to $207.81 million. Its net assets stood at $3.16 billion, as of October 29, 2022, compared to $2.88 billion, as of January 29, 2022.
Analysts expect FIVE’s revenue and EPS for the fiscal 2023 fourth quarter to increase 10.4% and 21.7% year-over-year to $1.10 billion and $3.03, respectively. Moreover, the company has surpassed consensus EPS estimates in three of the trailing four quarters.
In terms of forward P/E, FIVE is currently trading at 38.95x, compared to the industry average of 12.88x. The company’s forward EV/Sales multiple is 3.72, compared to the industry average of 1.09. Also, its forward EV/EBITDA multiple of 25.37 is significantly higher than the industry average of 9.15.
FIVE’s stock is currently trading above its 50-day and 200-day moving averages of $153.44 and $143.98, respectively, indicating a bullish trend. It has surged 16.4% over the past month and 48.5% over the past six months to close the last trading session at $179.16.
MarketClub’s Trade Triangles show that FIVE has been trending UP for all three-time horizons. The long-term trend for FIVE has been UP since October 26, 2022. Its intermediate-term and short-term trends have also been UP since October 25 and December 13, respectively.
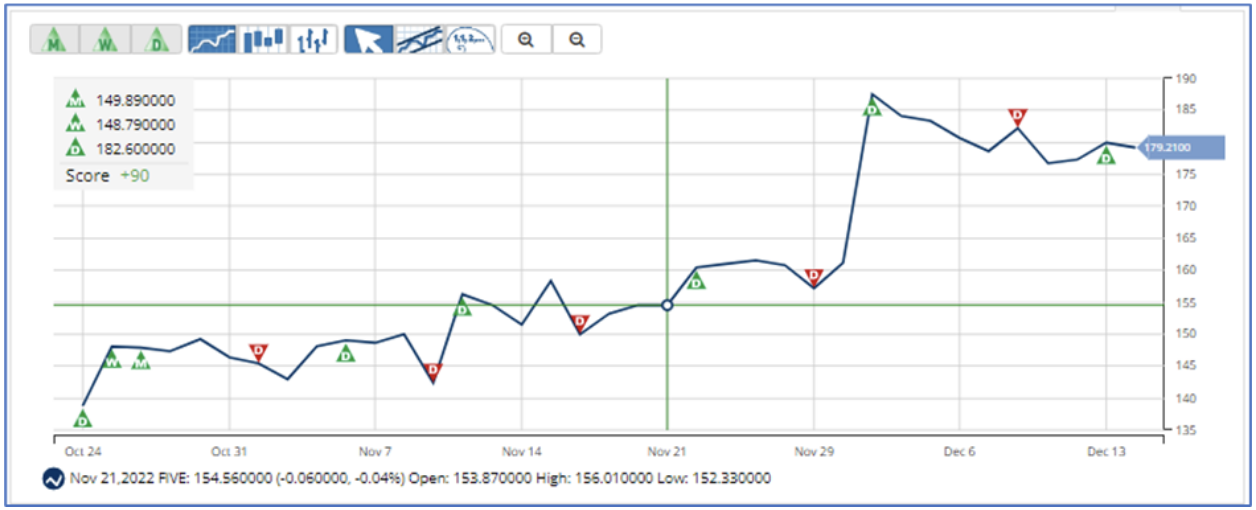
In terms of the Chart Analysis Score, FIVE scored +75 on a scale from -100 (strong downtrend) to +100 (strong uptrend), indicating signs of short-term weakness, but still remaining in the confines of a long-term uptrend.

Click here to see the latest Score and Signals for FIVE.
What's Next for These Retail Stocks?
Remember, the markets move fast and things may quickly change for these stocks. Our MarketClub members have access to entry and exit signals so they'll know when the trend starts to reverse.
Join MarketClub now to see the latest signals and scores, get alerts, and read member-exclusive analysis for over 350K stocks, futures, ETFs, forex pairs and mutual funds.
Best,
The MarketClub Team
[email protected]