China Recap: The Good And The Bad

Lior Alkalay - INO.com Contributor - Forex


A little more than a week ago, China released its data for second quarter GDP growth alongside other important data sets that, entwined, give us a glimpse into the health of the world’s second largest economy and a framework for FX strategy in the Asian space.

China’s second quarter GDP growth hit 6.7% for the second quarter year-on-year, the same growth rate as the first quarter and moderately higher than the 6.6% called for in Reuters’ consensus poll. The major contributor to GDP growth was consumption, a rather positive sign that consumers are becoming a more prominent engine in the Chinese economy. This was further enforced when China’s retail sales posted growth of 10.6% in June compared to 10.0% in May.

But on the flip side, there were some negative signs as well, and plenty of them. GDP growth was, indeed, driven by consumption but the growth in the services sector, or the tertiary industry as it is referred to, was 7.6% Year on Year. That is simply not enough to accommodate China’s weakness in manufacturing and not exactly in line with China’s growth plans. Continue reading "China Recap: The Good And The Bad"

Mexican Peso Set To Rally Against EUR And JPY

Lior Alkalay - INO.com Contributor - Forex


The Mexican economy has been remarkably resilient to weakness in the US. Mexico’s exports to the US amounted to $295 Billion in 2015, a staggering 77% of total Mexican exports. Under such circumstances, one would expect the slowdown in US growth in the first quarter to tank the Mexican economy. Instead, robust growth in consumer spending allowed Mexico to grow at a fair pace of 2.6%, year-on-year. But now, as the tide in the US economy turns, the Mexican manufacturing sector, which suffered during the first quarter, could recover. Mexican GDP growth will move higher, and monetary policy will turn tighter. And the main benefiter? It’s the Mexican peso, which has been undervalued for quite a while.

How US Manufacturing Impacts Mexico

Mexico’s exports to the US are varied, ranging from beef to oil, yet the bulk of its US-destined exports are manufactured goods. Vehicles, vehicle parts, tractors, trucks and computer screens are among the manufactured items, and the list goes on. Transports and Machines are the top two categories and amounted to $186 Billion in 2015. Continue reading "Mexican Peso Set To Rally Against EUR And JPY"

Sterling Set for Strong Rebound In July

Lior Alkalay - INO.com Contributor - Forex


Worries over an exit of Britain from the European Union have taken their toll on Sterling. As June 23rd approaches, the day in which Britons will vote to either stay or leave, so does the pressure on the Pound Sterling mount. Media polls are failing to indicate a clear result, and the FX market is getting nervous. And yet, a Brexit seems unlikely and when markets price in the unlikely—even partially—it’s worth taking the other side.

Why A Brexit Still Seems Remote

The risk of a Brexit is mostly economic. Warnings of the financial calamity that could hit the UK have been coming from notable economists from the UK Treasury but the most noteworthy and important warning came from the Bank of England.

The Bank of England Governor, Mark Carney, delivered a stark warning in his latest conference. Carney laid out a rather bleak scenario in case Britons choose to exit the union. The BoE Governor stressed that growth would falter, unemployment would jump and inflation could spin out of control. Continue reading "Sterling Set for Strong Rebound In July"

The Dollar Takes 'EM Down

Aibek Burabayev - INO.com Contributor - Metals


Dear readers, I am very grateful to get all your feedback and suggestions that you kindly share with me all the time! Rasesh Shukla, one of our regular readers asked about the Emerging market currencies and particularly about Indian rupee in a comment this month. And I am pleased to share my thoughts with all of you in this post.

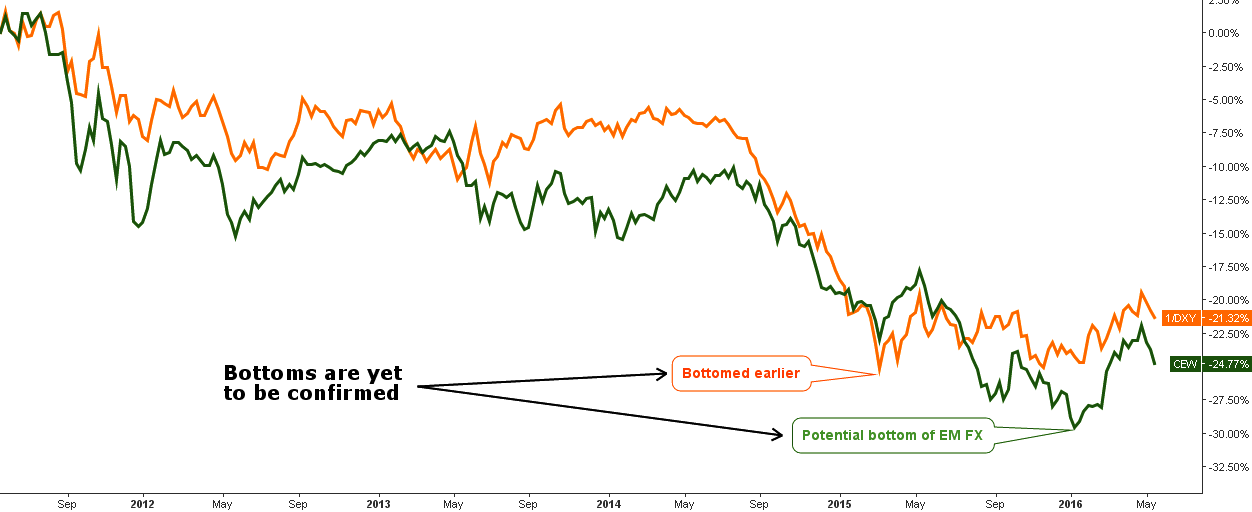
Chart 1. 5-Year Dynamics of Top FX vs. EM FX

5-Year Dynamics of Top FX vs. EM FX
Chart courtesy of tradingview.com

I want to start with the comparison chart of the top currencies presented by inverse dollar index, consisting of 6 currencies: Euro, Japanese Yen, British Pound, Canadian Dollar, Swedish Krona and Swiss Franc (orange line) versus the emerging market currencies presented by WisdomTree Emerging Currency Strategy Fund (CEW, green line). The former is quite representative, it tracks the value of the following 15 currencies: Mexican Peso, Brazilian Real, Chilean Peso, Colombian Peso, South African Rand, Polish Zloty, Russian Ruble, Turkish New Lira, Chinese Yuan, South Korean Won, Indonesian Rupiah, Indian Rupee, Malaysian Ringgit, Philippine Peso and Thai Baht. Continue reading "The Dollar Takes 'EM Down"

The Dollar Index: Make Or Break?

Aibek Burabayev - INO.com Contributor - Metals


In this post, I would like to offer a global outlook for the gauge of the most financial assets, for the US dollar via its index DXY.

It is important to understand the global trend for the dollar to plan our precious metals strategy. I've included four charts below with different periods of observations and you can judge for yourself what you are after.

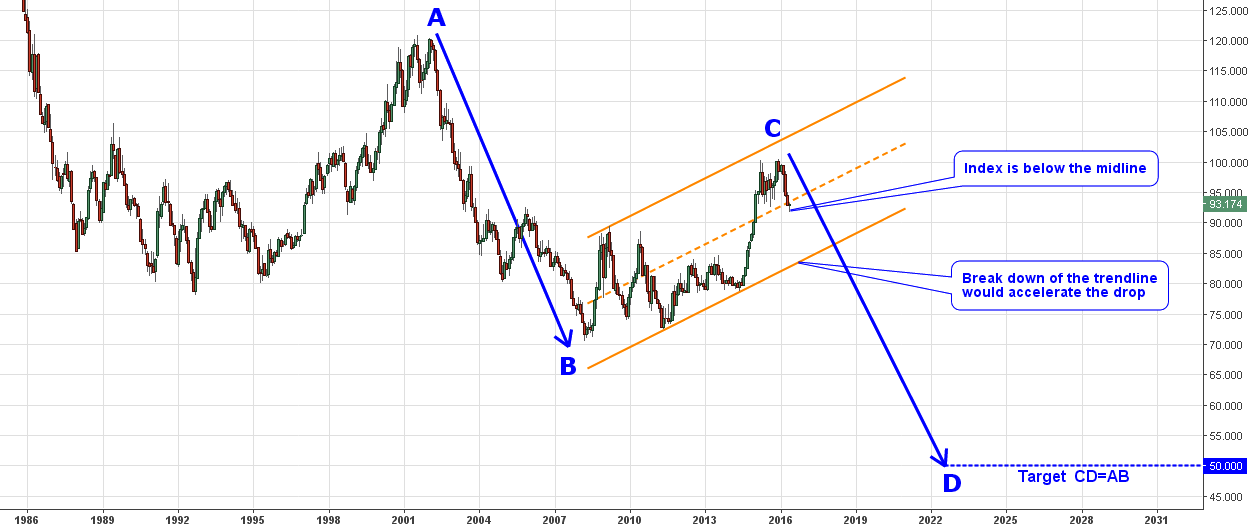
Chart 1. Dollar Index Monthly (1985-2016): Looks Bad!

Dollar Index Monthly
Chart courtesy of tradingview.com

On the monthly chart above, we see that the dollar dropped from the 125+ levels, then made a correction to the blue A point at the 121 level. After that, from 2001, we saw another massive sell-off of 51 points down to the 70 level in he notorious 2008. Continue reading "The Dollar Index: Make Or Break?"