It’s really amazing to see how some people take a selfie every day from childhood and then compile a video from those photos to see the timeline of their life.
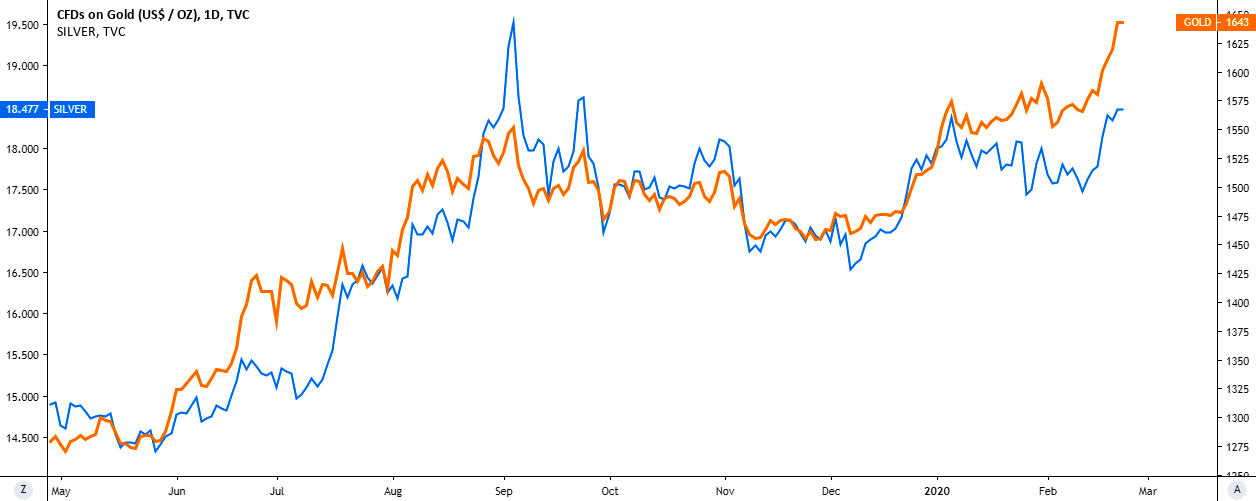
As gold reached all preset targets, hitting a new seven-year maximum of $1704, I think it’s an excellent time to contemplate the history of this large move up. I put the charts from the previous posts one by one to restore the timeline with my comments for you. Let’s start the time machine!
Chart 1. Global Monthly Chart Of 2016
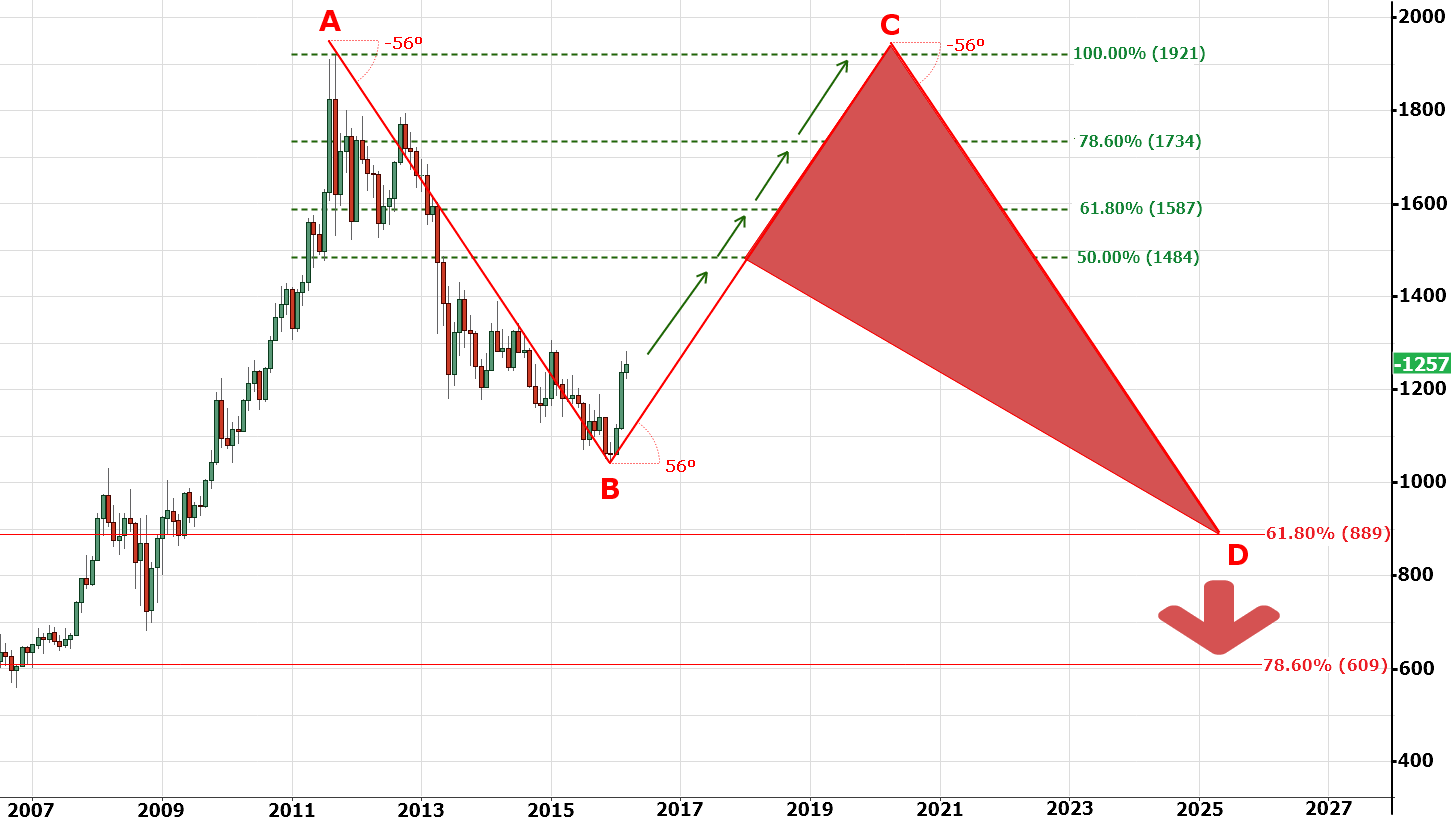
Chart courtesy of tradingview.com
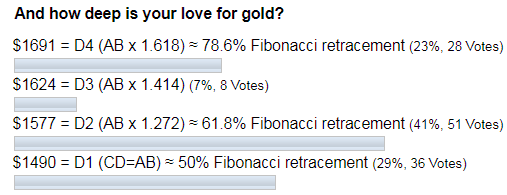
Four years ago, when the “Bulls Finally Took The Ball”, I posted a big map to share with you my view about a possible sizeable complex correction for gold to warn you of a time-consuming zigzag move. It was meant to become a real roller coaster with a big up and down move. It consists of two Fibonacci retracement areas. Green colored was set for the current move up. We almost reached 78.6% last week as price grew by $447 or 36% since that post in 2016. Continue reading "Gold Update: That's It?"