Copper Update: Crude Oil Signals To Cover Shorts

Aibek Burabayev - INO.com Contributor - Metals


Last month, I published a post about the correlation of the World GDP and Copper prices. I also covered the close correlation of Crude Oil and Copper prices.

Chart 1 Crude Oil weekly: Sharp rebound

NYMEX Crude Oil
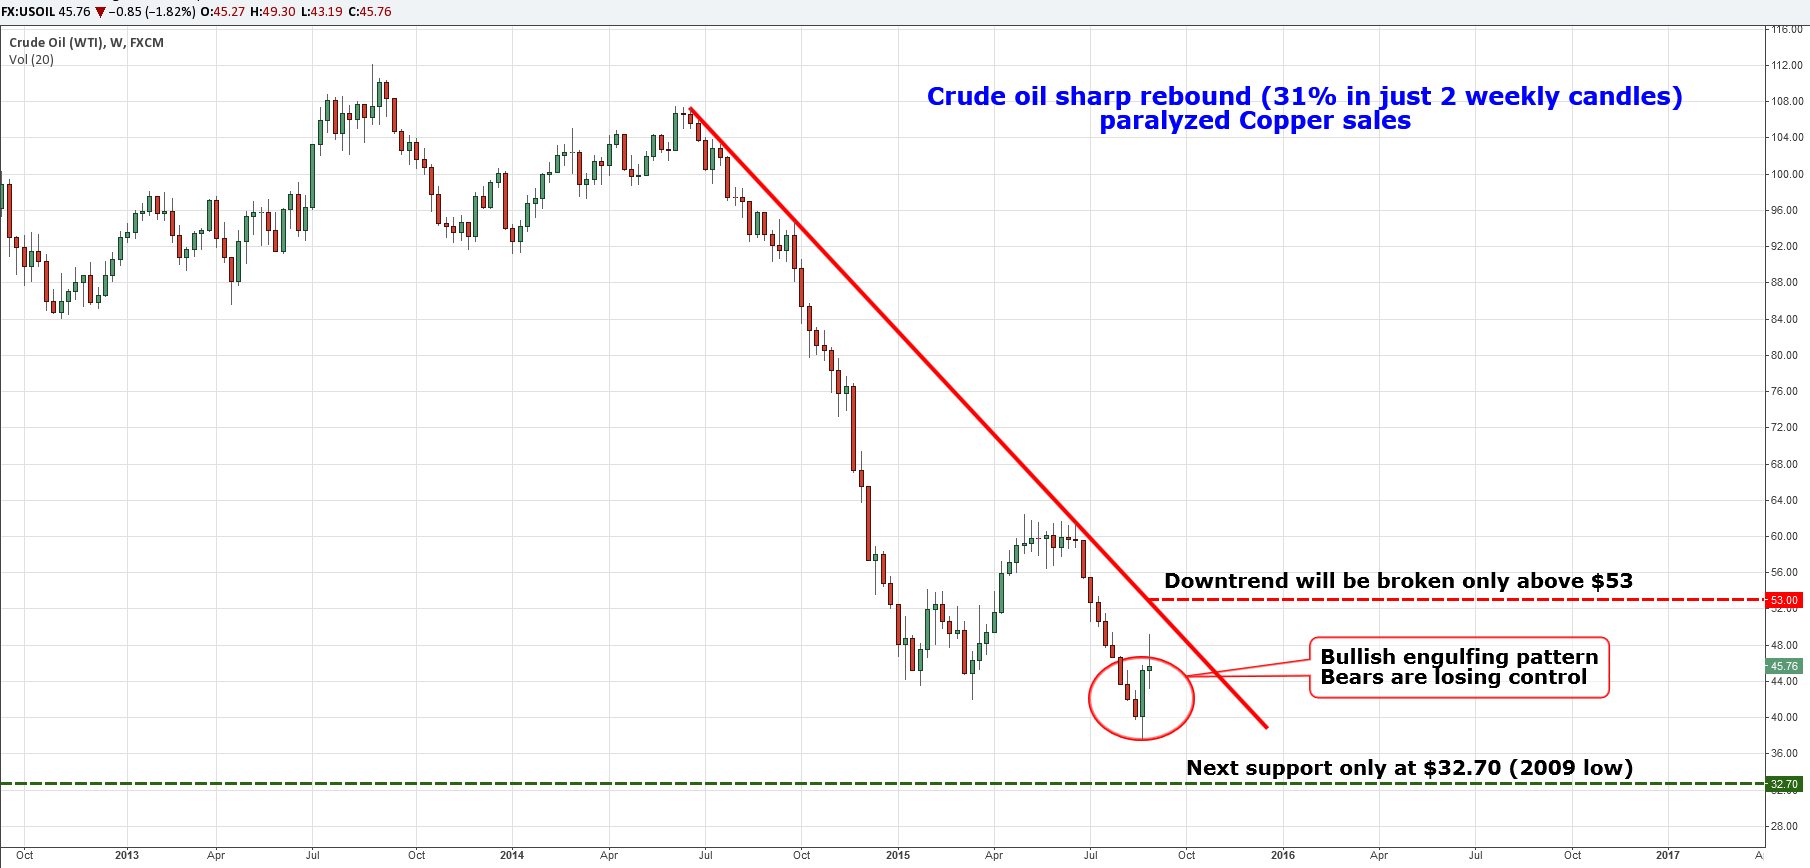
Chart courtesy of TradingView.com

As seen in the above weekly chart, Crude Oil bulls attacked the market without a declaration of war and caught sellers unaware. The price quickly grew more than $10 in just three days.

This severe price action on the weekly chart has formed a so-called Bullish Engulfing pattern. That's when the small red bearish candlestick is followed by a large green bullish candlestick that completely eclipses (engulfs) the previous week's candlestick. It means that bulls have taken control of the market and the price has gone lower (or is at the end of the decline). Continue reading "Copper Update: Crude Oil Signals To Cover Shorts"

Is This The End Of The Bull Market?

Today I'm going to be analyzing charts of the DOW, NASDAQ and the S&P500 and the potential divergence I see in those markets.

It's too early to tell if these markets are going to reverse down and calling tops is never easy, nor am I trying to do that in this particular posting. What I am doing, however, is bringing to your attention a potential problem and a potential opportunity.

What I mean by that somewhat contradictory statement is that these markets could go either way. However, the odds would still favor trading with the trend and the major trend in both the DOW, NASDAQ and the S&P500 continues to be to the upside.

INDEX:DJI

In the three charts I have laid out today you can see the #1 and #2 quite clearly. #1 indicates that prices are going higher and #2 indicates that momentum is not following prices. This could be an early warning sign that things aren't quite up to par and as strong as I would like to see. Continue reading "Is This The End Of The Bull Market?"